Chapter 3 -- The Metamorphoses of Capital
Thomas Piketty, Capital in the 21st Century (Harvard University Press 2014)
Patrick Toche
Introduction
- This set of slides surveys selected topics from Capital in the Twenty-First Century, a book written by economist Thomas Piketty, published in English in 2014 to great acclaim.
- All source files for this course are available for download by anyone without restrictions at https://github.com/ptoche/piketty
- The full course is expected to be completed by April 2015.
- Chapter 2 reviewed the main stages of income and output growth since the Industrial Revolution.
- Chapter 3 reviews the metamorphoses of capital in the United Kingdom and France since the eighteenth century.
The Transformation of Capital
- Figures 3.1 and 3.2 show the capital structure of the UK and France.
1. The capital/income ratio \(K/Y\) followed an inverted-bell curve ('U-shape'). Stable in the 18th and 19th centuries at about 600% or 700%; very large decline to 200% or 300% in the 20th during the depression and WWII; going back to the pre-WWI level after WWII.2. The composition of capital \(K\) has transformed over the very long run: agricultural land has been replaced by buildings, business capital, and financial capital invested in firms and government organizations.
- The depression, the wars, and inflation during 1914-1945 wiped the slate clean and created the illusion of virtuous, merit-based capitalism — the 'myth of the Kuznets curve' debunked by Piketty.
The Structure of Capital
- 3 categories of capital:
1 farm land; 2 residential land & housing; 3 other types including land and buildings used for business, infrastructure, machinery, computers, patents.
National capital \(=\) farmland \(+\) housing \(+\) other domestic capital
\(+\) net foreign capital
- In 1700, the total value of farmland represented 400% to 500% of national income, nearly 2/3 of total national capital and 3/4 of all economic activity and employment. The value of housing was 100% of national income; the 'other' category, the same as housing.
- In 2010, farmland is less than 10% of national income, less than 2% of capital. Housing is 300% of national income; like the 'other' category.
The Transformation of Capital
There are 2 main causes behind this structural transformation:
1. growing importance of housing quality and value (driven by urbanization and agglomeration for production purposes);2. growing importance of buildings and structures in the production of non-agricultural goods and services (machinery, warehouses, offices).
The Rise and Fall of Foreign Capital
- The role of foreign capital in the economies of the United Kingdom and France follows the ups and downs of their colonial history.
- Foreign possessions first became important around 1750–1800.
- Net assets owned in the rest of the world peaked at high levels in 1914, collapsed during 1914–1945, have since stabilized at a much lower level.
- In 1914, the UK had the largest colonial empire and owned foreign assets worth 200% of national income — 6 times the value of domestic farmland. Foreign assets were yielding 5% a year in dividends, interest, and rent. National income was 10% higher than domestic product.
- France had the 2nd largest colonial empire, owned foreign assets worth more than 100%. National income was 6% higher than domestic product.
The Rise of Foreign Capital
- These very large net foreign assets allowed the UK and France to run structural trade deficits.
- During 1880-1914, both countries' trade deficits averaged 1–2% of national income. That is, both countries imported more goods and services from the rest of the world than they exported.
- Because their income from foreign assets exceeded 5% of national income, their balance of payments was strongly positive and their holdings of foreign assets increased year after year!
- Thus, while the colonial powers consumed more than they produced, the colonized countries increased their debt to the colonies!
The Fall of Foreign Capital
- Following 2 world wars, some local wars, 1 depression, high inflation, the British and French empires lost their colonies and foreign wealth.
- After 1950, their net foreign asset holdings have remained close to zero.
- In 2010, net foreign assets are negligible, as they were in 1700. The ratio of total capital to national income is similar in both periods.
- The most important long-run structural change is the fall of farmland and the rise of real estate and working capital.
Income and Capital Today
- The UK and France are typical rich countries.
- National income per capita is about 30,000 euros per year.
- National capital 180,000 euros per capita — 6 times national income.
- Farmland is a few thousand euros per capita.
- National capital includes about 90,000 euros in housing and 90,000 euros of other domestic capital, such as financial instruments.
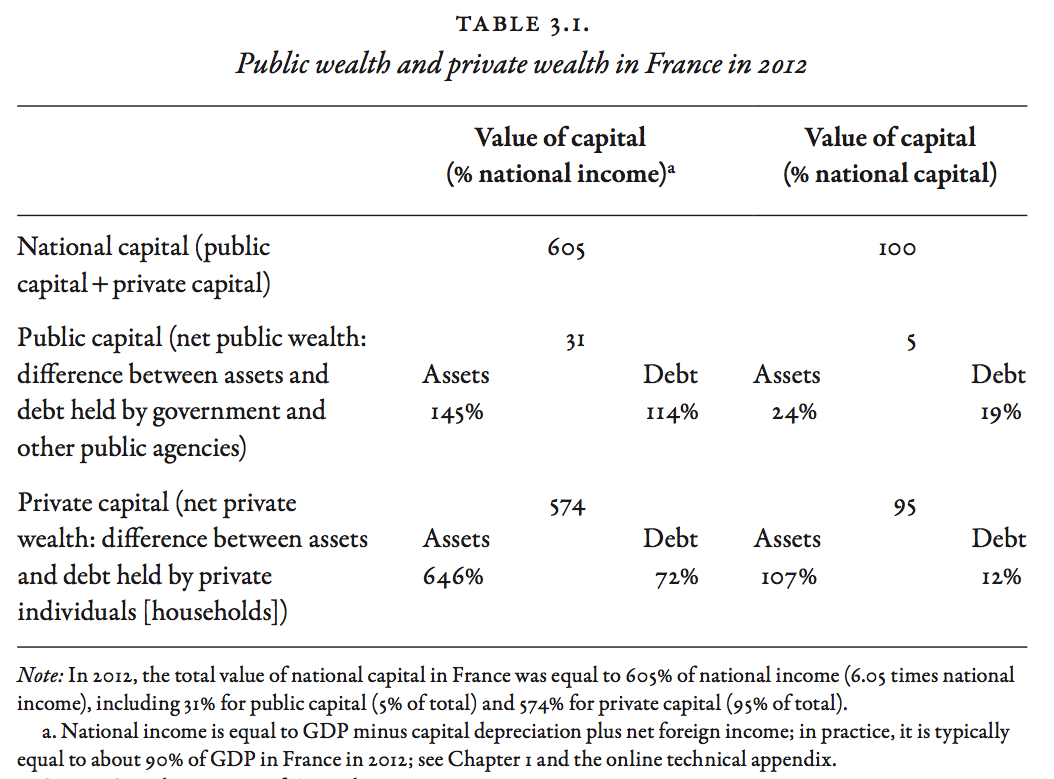
Public & Private Capital
- Figures 3.3 and 3.4 shows public assets and public debt in the UK and France, and Figures 3.5 and 3.6 show public and private capital.
- Public capital is the difference between assets and liabilities of the state.
- Private capital is the difference between assets and liabilities of people.
- National capital is the sum of public capital and private capital.
- Public assets include non-financial wealth (public buildings such as schools, universities, hospitals) and financial wealth (stocks of private corporations, foreign currencies, gold).
- Public assets (financial and non-financial) are about 100% of national income in the UK and 150% in France.
- Public debt are about 100% of national income in both countries.
- Net public wealth is close to zero in the UK, about 30% in France.
Net Public Wealth
- If the French and British governments decided to sell off all their assets and pay off their debts, there would be 'nothing' left.
- But these estimates are imprecise. It is not easy to set a precise market value on schools and hospitals, on railway lines, on highways.
- The difference between financial and non-financial assets can be arbitrary.
- When the French government privatized 'France Telecom' and the Post Office, the buildings and structures previously treated as non-financial assets became classified as financial assets.
- Private wealth accounts for 95-99% of national wealth in both countries. These are 'capitalist' — not communist — economies.
Public Debt in British History
- The United Kingdom has a long history of borrowing 'to the hilt.'
- During 1700–1720, public debt reached 50% of national income. During 1760–1770, 100%. After the Napoleonic wars and after WWII, it has exceeded 200% of GDP.
- The large rise in public debt of 1770–1810 was financed largely by a rise in private saving, so that national capital remained stable at around 700% of national income.
- The deficits raised demand for private wealth and bid up its return, making government bonds attractive relative to other assets.
- The public debt did not 'crowd out' private investment. There was no perceived conflict of interest between the public and private sectors.
Public Debt in British History
- It took a century of budget surpluses to gradually reduce public debt — to below 30% by 1914 — successive government did not repudiate it.
- From 1815 to 1914 — a century! — the UK government paid 5% of GDP every year to their (wealthy, willing and happy) creditors, financing this transfer of wealth with 'primary' surpluses (the primary surplus is tax revenue minus non-interest government spending).
- Public debt lost its significance because national income outgrew it, mostly because of strong economic growth.
Public Default in History
- Following the 1789 Revolution and 'terreur', France defaulted on 2/3 of public debt ('banqueroute des deux tiers'), resorted to high inflation (episode of the 'assignats'), and by 1815 the public debt accumulated by the 'Ancien Régime' had fallen below 20% of national income.
- Revolutions are often followed by a default on public debt: the confederate states in 1865 (end of the American civil war), the Russian 'Soviets' in 1917 and Chinese 'Maoists' in 1949 (communist revolutions).
- Another form of default is 'surprise' inflation. Inflation in 1913–1950 averaged 13% a year (prices multiplied by 100) in France — 3% a year (prices multiplied by 3) in the UK. In 1950-1980 inflation averaged 6% (prices multiplied by 6) in the UK, 10% in the 1970s alone. Inflation shrunk the real value of debt and 'solved' the debt problem.
Who's Afraid of the Public Debt?
- Europe, America, Japan are heavily in debt. A government bond is a claim of one segment of the population (those who receive interest) on another (those who pay taxes). Why should debt matter?
- In the 19th century, Marx observed rising interest rates and saw public debt as a 'lever' of the accumulation of private capital — a tool of the rich
- Friedman saw public debt as a 'lever' of public spending and wealth redistribution — a tool of the poor.
- Ronald Reagan and G.W.Bush saw public debt as a 'lever' to force (on future administrations) cuts in public spending and 'kill the Leviathan'.
- The value of the interest paid on public debt and the use of the public funds matter in the perception of debt as a necessary 'good' or 'evil.'
'Ricardian Equivalence'
- In 1817, David Ricardo suggested that public debt need not always 'crowd out' private capital — that it is no more than a claim of one group of people on another.
- While British public debt was 200% of GDP, private investment was healthy — the public debt was financed by a rise in private saving. The gigantic public debt had no effect on national wealth.
- In 1936, John Maynard Keynes felt that the 'euthanasia of the rentier' would be the simplest way to reduce the burden of the public debt.
- 'Ricardian Equivalence' was revived by Robert Barro in the 1970s, to promote the use of 'representative agent' models of rational, forward-looking agents, and the prescription that debt should be issued to smooth taxes over time and would be ineffective as a redistribution tool.
Who's Afraid of Inflation?
- Inflation is a powerful tool for wealth redistribution.
- It destroys the value of bonds more than other forms of wealth.
- It destroys the purchasing power of cash for rich and poor alike.
- It works only by surprising bond holders, who then learn to distrust government and demand higher nominal interest rates to compensate for inflation and its risk.
- Once built into expectations inflation becomes persistent and costly.
- Eliminating inflation requires banking reforms and a strong recession.
- The Germans are afraid of inflation, very afraid. So are the French.
Who's Afraid of Government?
- The history of public assets is less erratic than that of public debt.
- The value of public assets rose from 50% of national income in the 17th century to 150% in France and 100% in the UK today.
- This reflects the expansion of the state, in particular in the areas of health, education, transportation, and communication.
- Periods of privatization and nationalization have alternated. Reagan and Thatcher initiated a wave of privatization in the 1980s. France, Japan, and of course the former Soviet Union also privatized on a grand scale.
- Famous British corporations privatized since the 1980s: British Petroleum, British Aerospace, British Gas, British Steel, British Telecom, Sealink ferries, Rolls-Royce, British Rail.
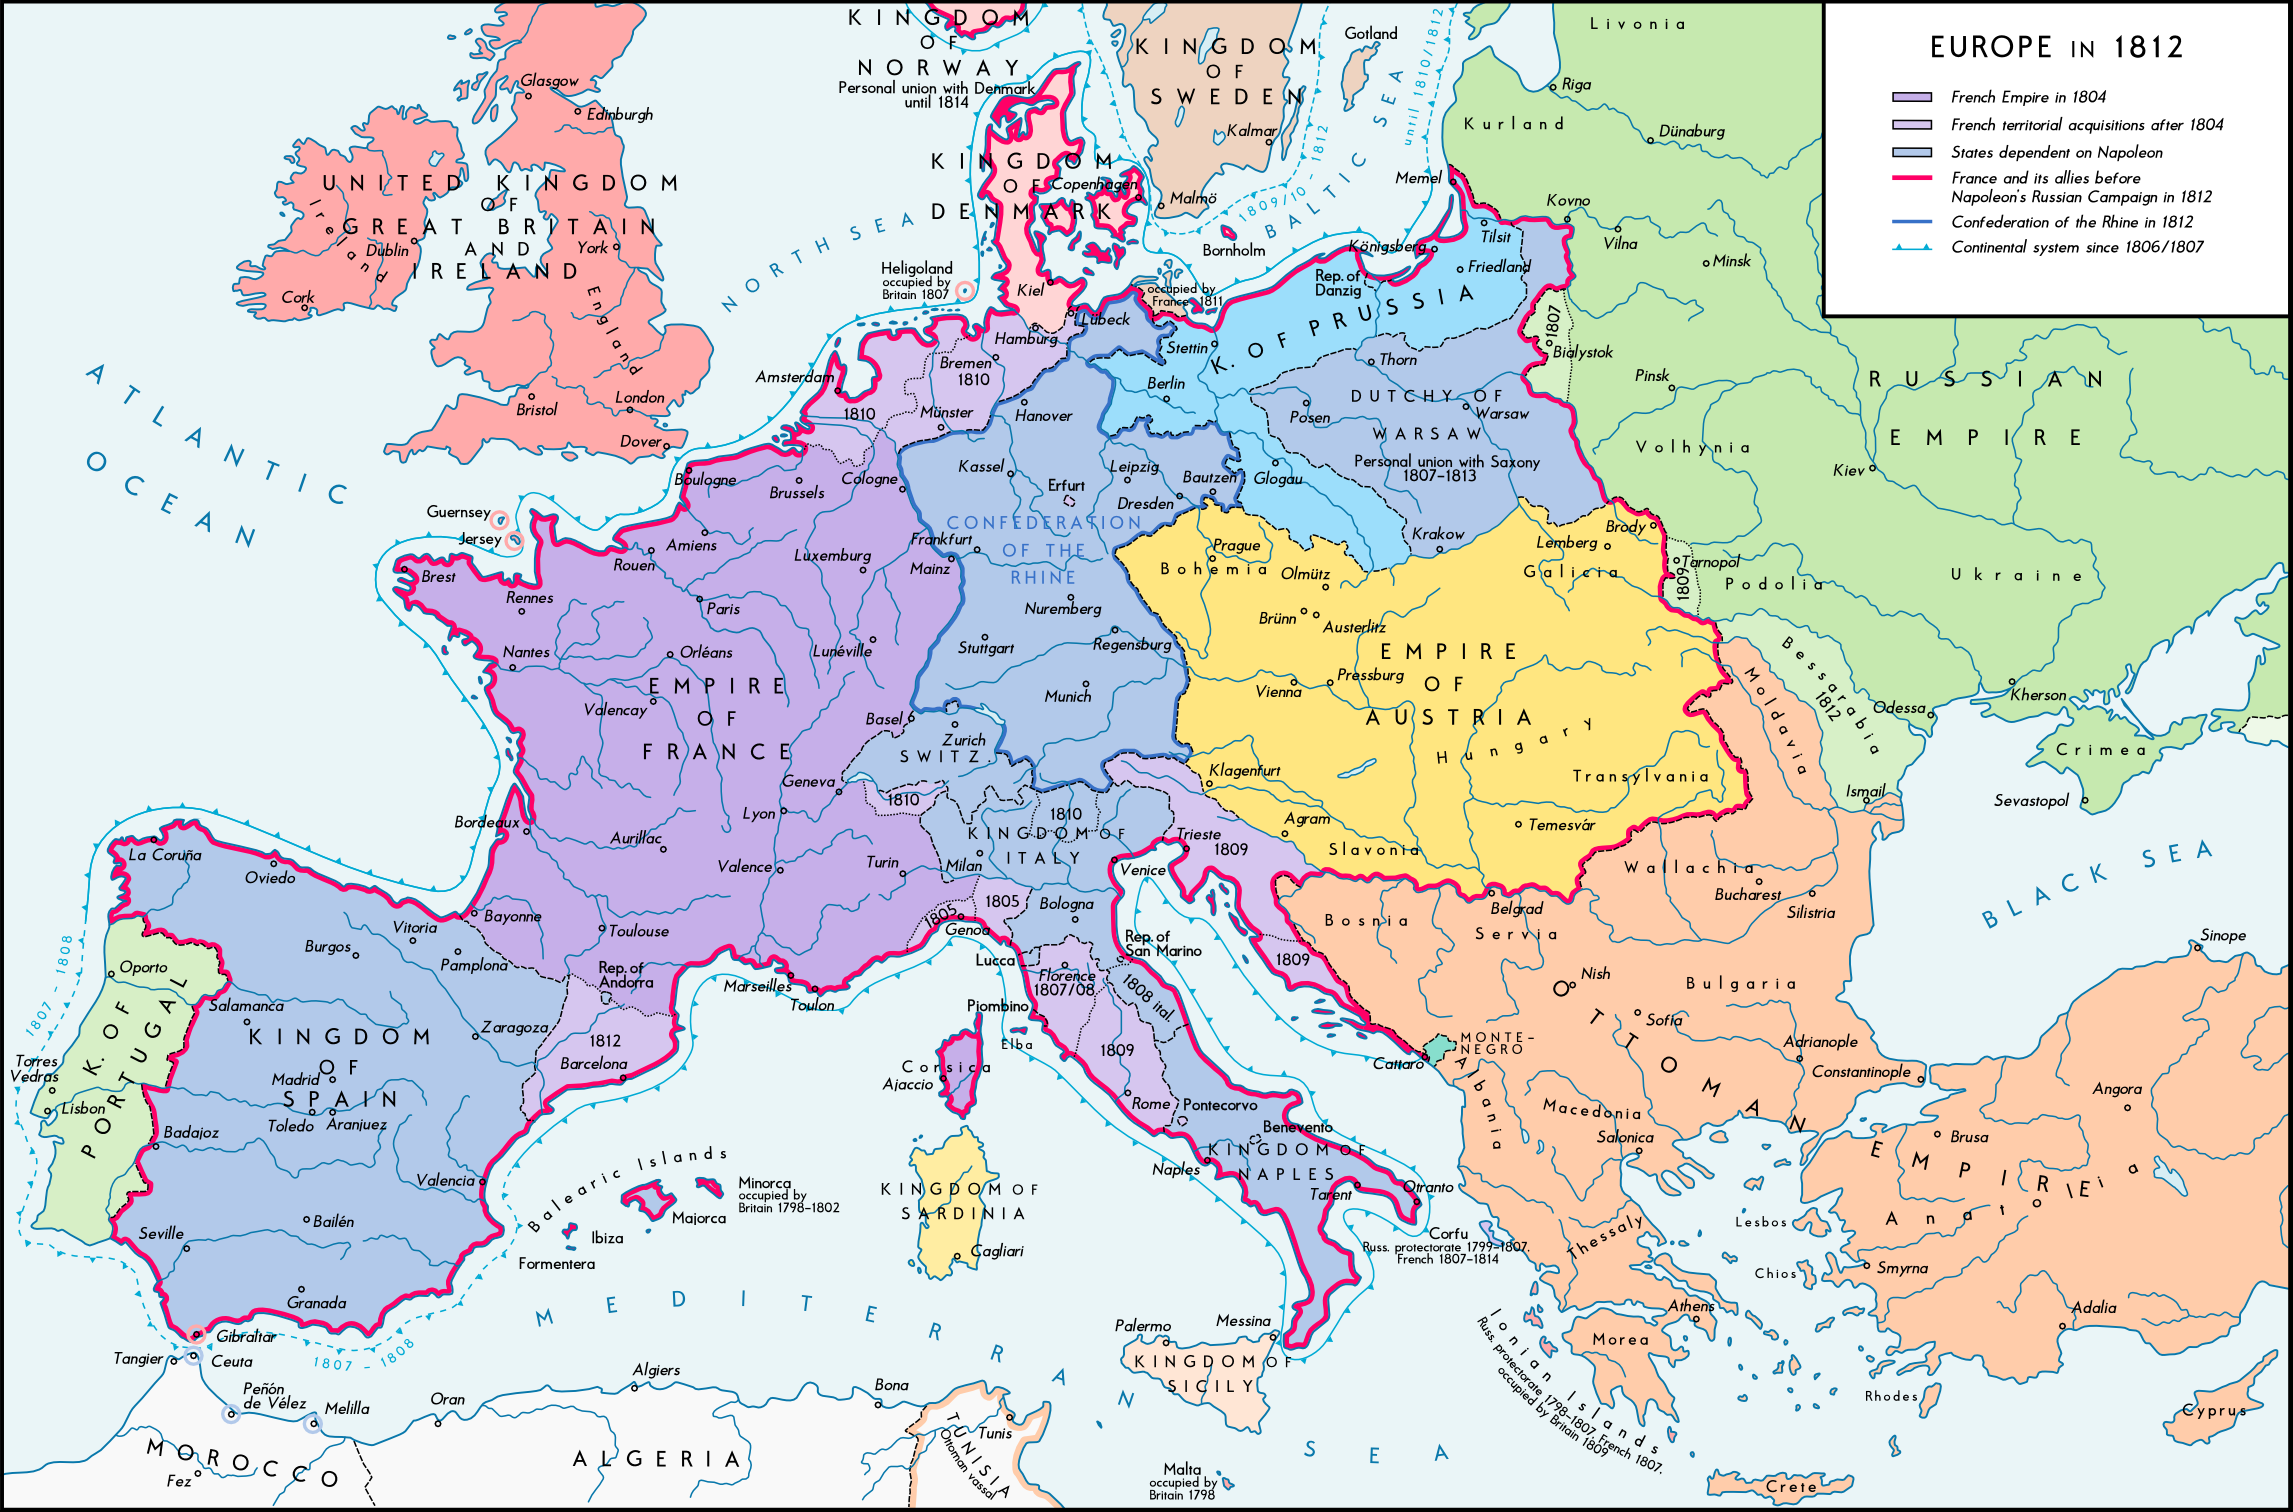
Napoleonic Wars: Europe in 1812
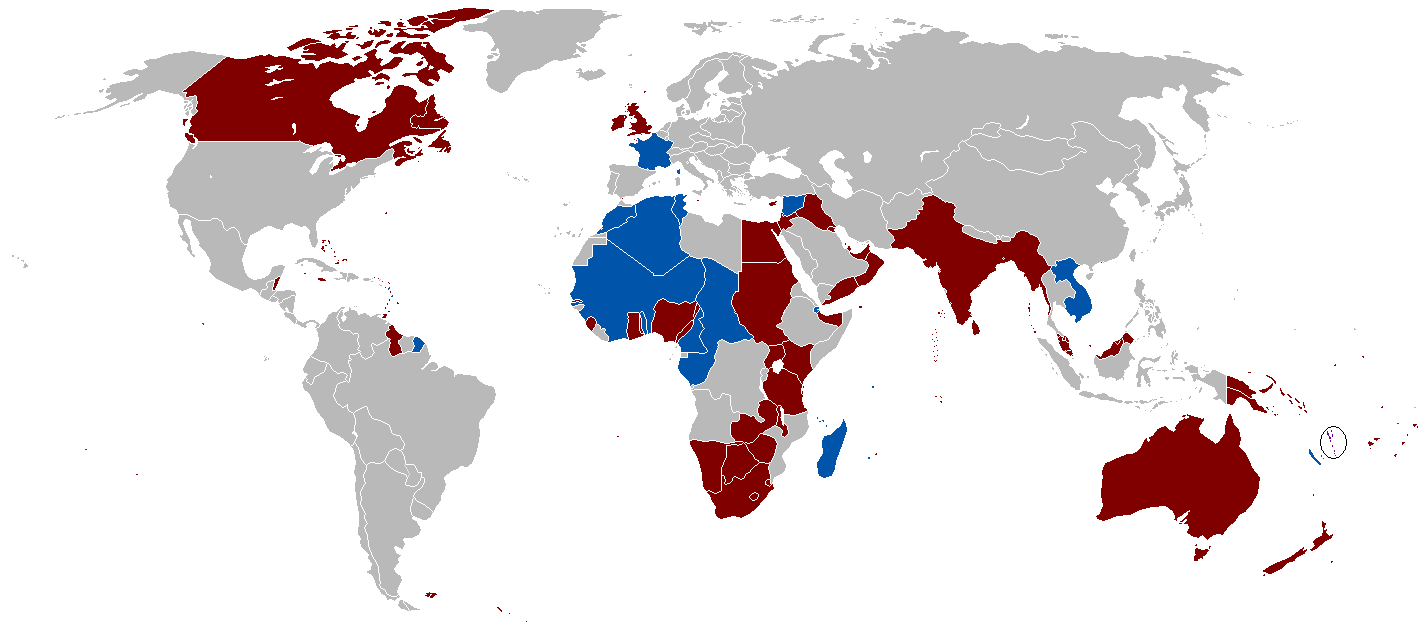
The British and French Empires in 1920