Chapter 5 -- The Capital/Income Ratio Over the Long Run
Thomas Piketty, Capital in the 21st Century (Harvard University Press 2014)
Patrick Toche
Introduction
- This set of slides surveys selected topics from Capital in the Twenty-First Century, a book written by economist Thomas Piketty, published in English in 2014 to great acclaim.
- All source files for this course are available for download by anyone without restrictions at https://github.com/ptoche/piketty
- The full course is expected to be completed by April 2015.
- Chapter 4 reviews the history of Germany, the United States and Canada, and addresses the question of slavery.
- Chapter 5 analyzes the capital/income ratio.
Explaining the Capital/Income Ratio
- The capital/income ratio has been fairly stable over the very long run, when it was not subject to violent shocks.
- Except during 1914–1945 when Europe fell behind North America, the capital/income ratio in Europe is typically at 600% to 700%, compared with 400% to 500% in North America (this is true of Germany if book values are used instead of stock market values).
- How can we explain these facts about the capital/income ratio? Why does it tend to rise so much in peace time? Why is it structurally higher in Europe than in the United States? Does it tend to an equilibrium level? Are there implications for the rate of return on capital? Are there implications for the capital-labor split?
The Second Fundamental Law of Capitalism
- Piketty's 'second fundamental law of capitalism' links the long-run capital/income ratio to national saving and economic growth: \[ \beta = s / g \]
- For example, if \(s = 12\%\) and \(g = 2\%\), then \(\beta = s/g= 600\%\).
- If a country saves 12% of its national income every year, and if the rate of growth of its national income is 2% per year, then in the long run the capital/income ratio will tend to the value 600%.
- A country that saves but grows slowly is accumulating capital relative to income. The effect on the distribution of wealth can be large. In a slow-growing economy, wealth accumulated in the past casts a long shadow.
Capital in a Stagnant Economy
- Today the capital/income ratio is close to the high levels of the 18th and 19th centuries.
- This is explained by slow growth, with the 20th century a long parenthesis.
- The slow-down in population growth is a primary cause.
- Small variations in the rate of growth can have very large effects on the capital/income ratio over the long run.
- For example, with a saving rate of 12% and a slower rate of growth of 1.5% a year, then the long-term \(\beta\) ratio will rise to 800% of national income.
- If the growth rate falls to 1%, the \(\beta\) ratio will rise to 1,200%.
Capital in a Stagnant Economy
- The 1-percent growth economy is twice as capital intensive as the 2-percent growth economy!
- The good news is that capital is useful to everyone, workers and capitalists alike. It is easier for the rich to transform a dollar of income into wealth — it is essentially impossible for the very poor to do so.
- The bad news is that the capitalists control a larger share of the total economy. With extreme concentrations of capital, the competitiveness of the economy and moral fabric of society are under threat. The Bush tax cuts for top incomes and Irak war on false pretense are arguably a reflection of this. The Berlusconi governments are the commedia dell'Arte version.
Capital in a Growing Economy
- If the growth rate rises to 3%, \(\beta\) will fall to 400% of national income.
- If the savings rate falls too, to \(s = 9\%\), then \(\beta\) will decline to 300%.
- The growth rate \(g\) is the growth rate of national income, the sum of the per capita growth rate and of the population growth rate.
- If the saving rate is 10% and the growth rate of national income per capita 1%, a country with no population growth (like Europe today) will accumulate capital worth 1,000% of national income, whereas a country with demographic growth of 1% (like the United States today), will accumulate capital worth 500% of national income.
- If that country saves 5% instead, then \(\beta\) will tend to be lower at 250%.
- The greater population growth and lower saving of the United States, relative to Europe, can explain the lower \(\beta\).
The Second Fundamental Law
- The 'second fundamental law of capitalism' is less 'fundamental' than the first. The 'first law' is a pure accounting identity, valid at all times in all places. The second law is a special case of an accounting identity, valid only when the economic system is at rest.
- The second law applies to the long-run; yet it is consistent with the historical evolution of the capital/income ratio — the shocks and transitions matter less than the long-run trends.
- It can explain why the capital/income ratio has been rising in peace time.
- It can explain why Europe accumulates more capital than the US.
- It cannot explain differences in demographics and saving behavior.
The Second Fundamental Law
- The 'second law' summarizes a state of equilibrium toward which an economy will tend if the 'fundamentals' of the economy have been constant for some time.
- At the individual level, fortunes are sometimes accumulated very quickly. At the country level it can take decades to raise capital substantially.
- For example, starting with no capital and a saving rate of 12% a year, it will take 50 years to accumulate the equivalent of 6 times national income.
- This would result in a capital/income ratio of 600% only if growth had been zero and income remained unchanged during the period, but in practice will result in much less since income will be growing over time (if only because capital is being accumulated).
The Second Fundamental Law
- The 'second law' is valid only for those forms of capital that are accumulated in a market ('disembodied' forms of knowledge, social capital, the environment and most natural resources are not included).
- If a significant fraction of national capital consists of pure natural resources, then \(\beta\) could be high without any contribution from savings.
- The second law is valid only if asset prices do not diverge from the general price index (the law can be generalized).
- If the prices of real estate or stocks rise faster than other prices, this will raise the \(\beta\) ratio even without 'real' increases in capital.
The Second Fundamental Law
- The 'second law' is independent of the reasons why the residents of a particular country or their government accumulate wealth.
- Countries accumulate capital for many reasons: to smooth their consumption across periods of work and retirement; to bequeath wealth to the next generation; as a buffer against shocks such as income losses in the labor market or in the stock market; to wield power and prestige.
- All these motives vary across individuals, age, places.
- The 'second law' does not explain shocks to the capital/income ratio.
Dynamics of the Capital/Income Ratio
- If a country saves 12% of its income every year and if its initial stock of capital is equal to 600% of national income, then the capital stock will accumulate at 2% a year, exactly the same rate as national income, so that the capital/income ratio will remain stable.
- If the capital stock is less than 600% of national income, then a savings rate of 12% will cause the capital stock to grow at a rate greater than 2% a year, faster than income, so that the capital/income ratio will be rising gradually until it reaches its equilibrium level.
The Return of Capital
- To see the difference between short-term and long-term movements of the capital/income ratio, consider annual changes between 1970 and 2010, a period for which there is reliable and homogeneous data.
- Figure 5.3 shows annual series of the capital/income ratio for the 8 richest countries in the world, in order of decreasing GDP: the United States, Japan, Germany, France, Britain, Italy, Canada, and Australia.
- The largely random fluctuations are caused by the volatility of real estate prices and financial assets.
- Beyond these unpredictable variations, there is a long-term trend.
Capital and Bubbles
- Speculative bubbles in real estate and stocks have always existed.
- Asset prices depend on expectations of future asset values, which can be erratic and driven by 'self-fulfilling beliefs'. Prices can drift away from fundamental values as individuals speculate that others may be willing to buy at values 'off the fundamentals'.
- The most spectacular bubble of 1970–2010 was the Japanese bubble of 1990, clearly visible in Figure 5.3. During the 1980s, private wealth rose from 400% of national income to 700%. This very quick rise was temporary, with \(\beta\) stabilizing at around 600% afterwards.
Capital and Shocks
- In 1991-1992, the Japanese real estate bubble deflated dramatically.
- In 1994–1995, the Italian real estate market had a big correction.
- In 2000–2001, the stock market (particularly the US and UK) experienced a bubble and bust in High-Tech companies and Internet start-ups.
- In 2008–2009 (the 'great recession'), US private wealth fell from 500% to 400% of national income, a drop comparable to Japan 1991–1992.
- The impact of a large shock on the capital stock works through both the price and the quantity — the price effect reduces capital in the short term, while the quantity effect reduces it in the long term.
- The impact of the great recession on the capital stock is hardly visible in the UK, France, Italy — \(K\) and \(Y\) must have moved roughly in proportion.
The Capital/Income Ratio
- The structural evolution of the capital/income ratio \(\beta\) is explained by 3 factors, which reinforce one another.
1. 'slow growth / high saving': the most important factor in the long run.2. 'privatization': the transfer of public wealth to the private sector.3. 'asset price recovery': catch-up of real estate and stock market prices.- Behind the slower growth, in Europe above all, are the slowdown in population growth and persistently high saving rates.
Average Per Capita Growth Rates
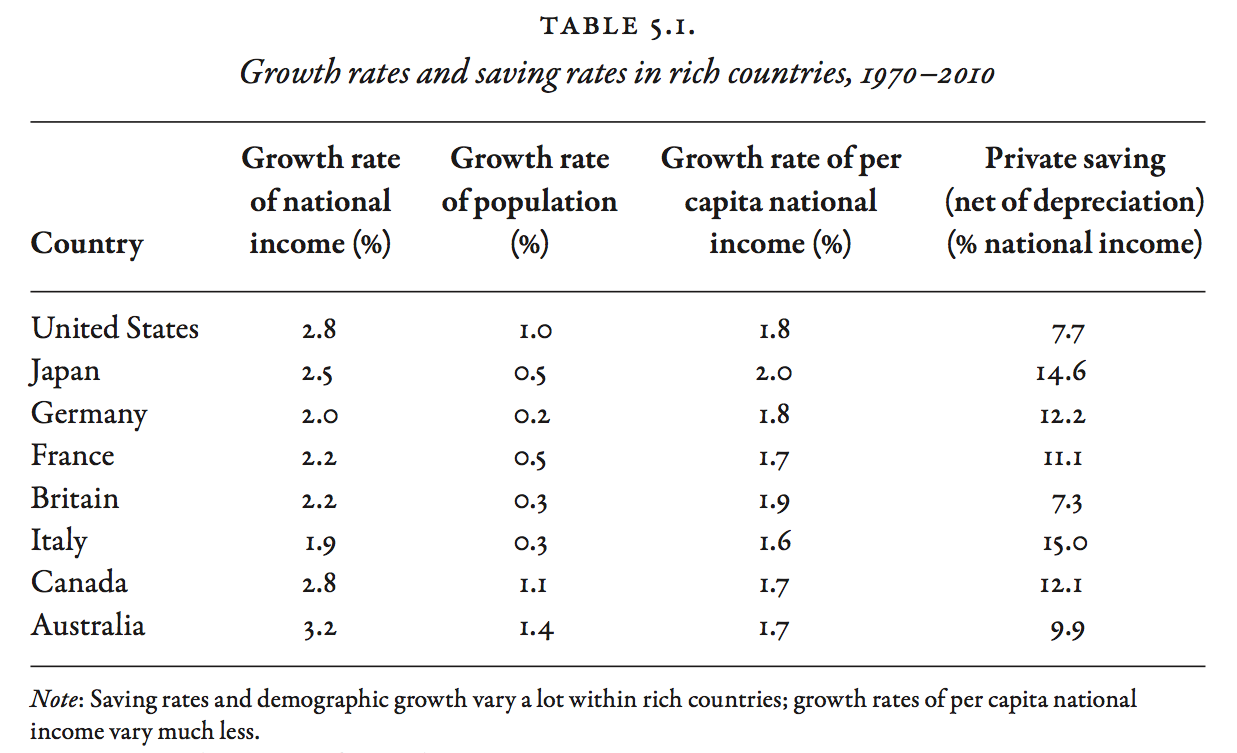
- Table 5.1 shows average values of the growth rates and private savings rates in the 8 richest countries.
- The rate of growth of per capita income in rich countries is similar.
- Comparisons over a few years can show large differences — not averages over the period 1970-2010.
- The average annual rate of growth of national income per capita ranges from 1.6% to 2.0% and is usually between 1.7 and 1.9.
- Compounded over long periods, differences of the order of 1% can have a large effect on capital accumulation. However, given the imperfections of the statistical measures — especially price indices — differences of the order of 0.1% should not be over-emphasized.
Average Economic Growth Rates
- Differences in per capita growth rates, among the rich countries, are very small compared with differences in population growth rates.
- During 1970–2010, population growth in Europe and Japan was less than 0.5% per year; in the United States, Canada, and Australia it was between 1.0% and 1.5% — significantly higher.
- During 1990–2010, population growth in Europe and Japan was even smaller and in some cases negative.
- Differences in population growth explain differences in national income growth, which grew at almost 3% in the US — only 2% in Europe.
- Structural differences in population growth between Europe and the US can explain structural differences in capital/income ratios.
Average Saving Rates
- There are large variations between countries during 1970–2010.
- The private saving rate is generally 10% and 12% of national income.
- The US and UK have had low saving rates averaging below 8%.
- Japan and Italy have had high saving rates averaging over 14%.
- Over 40 years, these differences in saving behavior create significant differences in accumulated capital.
- The countries that save the most are often countries with an ageing population — ageing societies plan for retirement and bequests.
The Capital/Income Ratio
- Variations in growth rates and in savings rate explain why countries accumulate very different quantities of capital. The levels of private wealth predicted for 2010 by the saving flows of 1970-2010 are similar to the actual levels in most countries.
- With a saving rate \(s = 15\%\) and growth rate \(g = 2\%\), Japan has accumulated capital worth 6 to 7 times national income (the relation \(\beta = s/g\) suggests 7.5).
- With a saving rate \(s = 8\%\) and growth rate \(g = 3\%\), the United States has accumulated capital worth 4 times national income (the relation \(\beta = s/g\) suggests 3, a discrepancy largely due to asset prices).
The Capital/Income Ratio
- Fluctuations in real estate prices and stock market values ('price effects') dominate short- and medium-run changes in \(\beta\), but matter little over the long run, where the flows of saving and economic growth are the main drivers ('volume effects').
- In Japan, the enormous rise in \(\beta\) in the 1980s and the sharp fall in the early 1990s was primarily caused by the growth and collapse of a real estate and stock price bubble ('price effects'), while the rise in \(\beta\) to 600% during 1970-2010 is predicted by the flow of savings ('volume effects').
Components of Private Saving
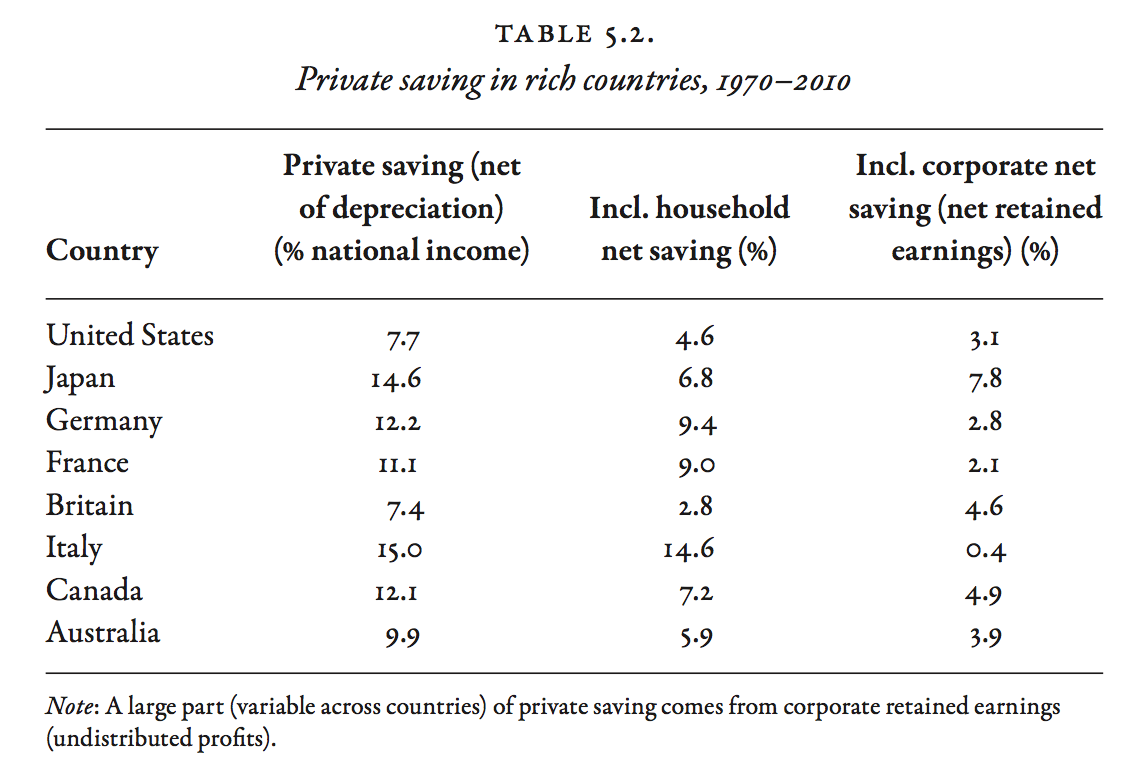
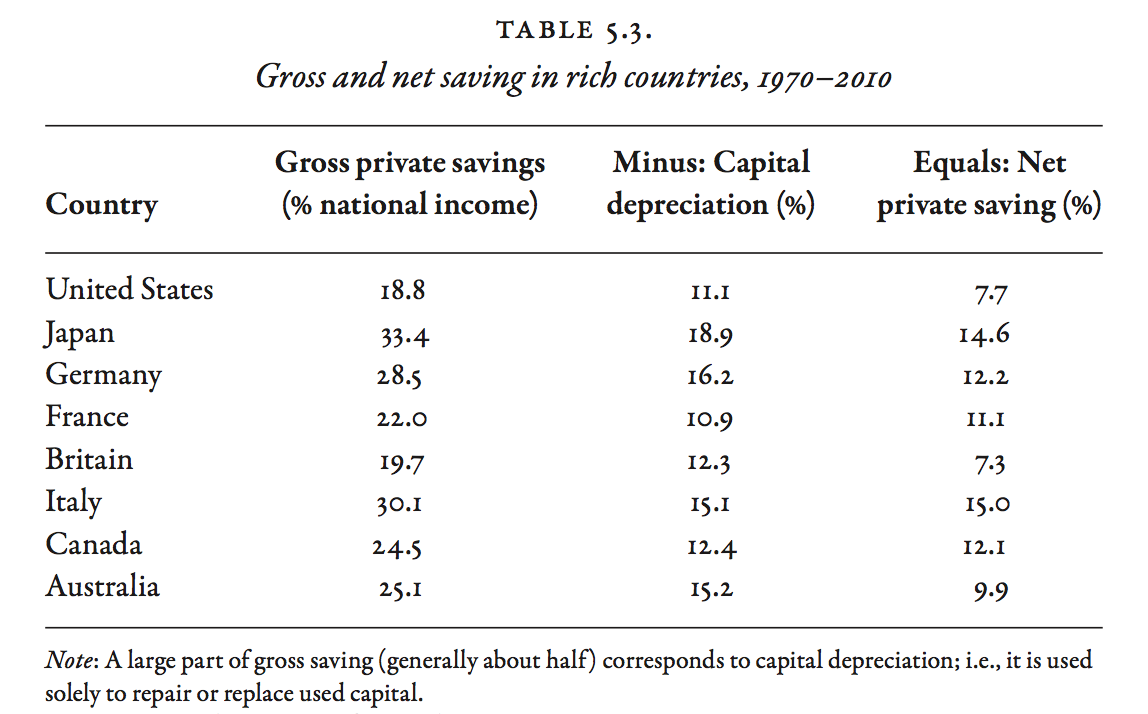
- Table 5.2 shows private saving rates in rich countries. Table 5.3 compares gross and net saving rates.
- Private saving consists of
1. saving by private individuals (the part of disposable household income that is not consumed) and2. saving by private firms ('retained earnings'). - Household saving alone cannot account for private wealth. In some countries retained earnings account for half of total private saving.
- The definition of saving in the relation \(\beta = s/g\) is saving net of capital depreciation. Annual capital depreciation is about 10% of national income and absorbs nearly half of gross savings. If gross saving is 25% of national income, net saving is 15%. The bulk of retained earnings typically pays to maintain buildings and equipment, leaving little to finance net investment.
Components of Private Saving
- If retained earnings were not included in private saving, the growth in stock market valuations would appear like a pure 'price effect.' But the reason that stock prices rise faster than consumer prices over the long run is that retained earnings allow firms to increase their capital stock (including patents). If retained earnings are included in private saving, the growth in stock market valuations is accounted as a 'volume effect'.
- Cross-country variations in the proportion of retained earnings in total private saving can be explained by differences in legal and tax systems — these are accounting differences rather than actual economic differences. This suggests that retained earnings should be included in private saving.
Durable Goods and Valuables
- Household purchases of durable goods (furniture, appliances, automobiles) are not included in private saving and private wealth; they are treated as consumption. This is consistent with national accounting standards (but does not make it 'right'). Some durable goods (computers, photocopiers) are counted as investments when purchased by firms!
- Durable goods account for most of the wealth owned by a large segment of population, but they are small in relation to total private wealth.
- Adding durable goods to private wealth would add 30-50% of national income, compared to 500% or 700% for national wealth.
- The only non-financial assets included in national accounts are 'valuables' (works of art, jewelry, gold, silver). These valuables are worth between 5% and 10% of national income, less than durable goods.
Private Capital & Disposable Income
- The capital/income ratio is greater when expressed as a percentage of disposable income, rather than national income.
- To go from national income to disposable income, we deduct all taxes and other obligatory payments, and add all monetary transfers (pensions, unemployment insurance, aid to families, welfare payments).
- When expressed in terms of disposable income, the ratio takes the income available to households as reference, ignoring the value of public services (including health and education services).
- Ignoring 'transfers in kind' would distort international comparisons and omit the effect of changes in welfare state provisions. Piketty therefore recommends expressing capital as a percentage of national income.
Private and Public Capital
- Organizations that depend primarily on public subsidies are classified as governmental organizations. Organizations that depend primarily on the sale of goods are classified as corporations.
- Estimates for rich countries in 1970–2010 show that foundations and other non-profit organizations own less than 10 percent and generally less than 5 percent of total private wealth, though with interesting variations between countries (1% in France, 4% in Japan, 7% in the US).
- The total value of church-owned property in 18th-century France was 8% of total private wealth. Some of this was confiscated and sold during the French Revolution.
Privatization
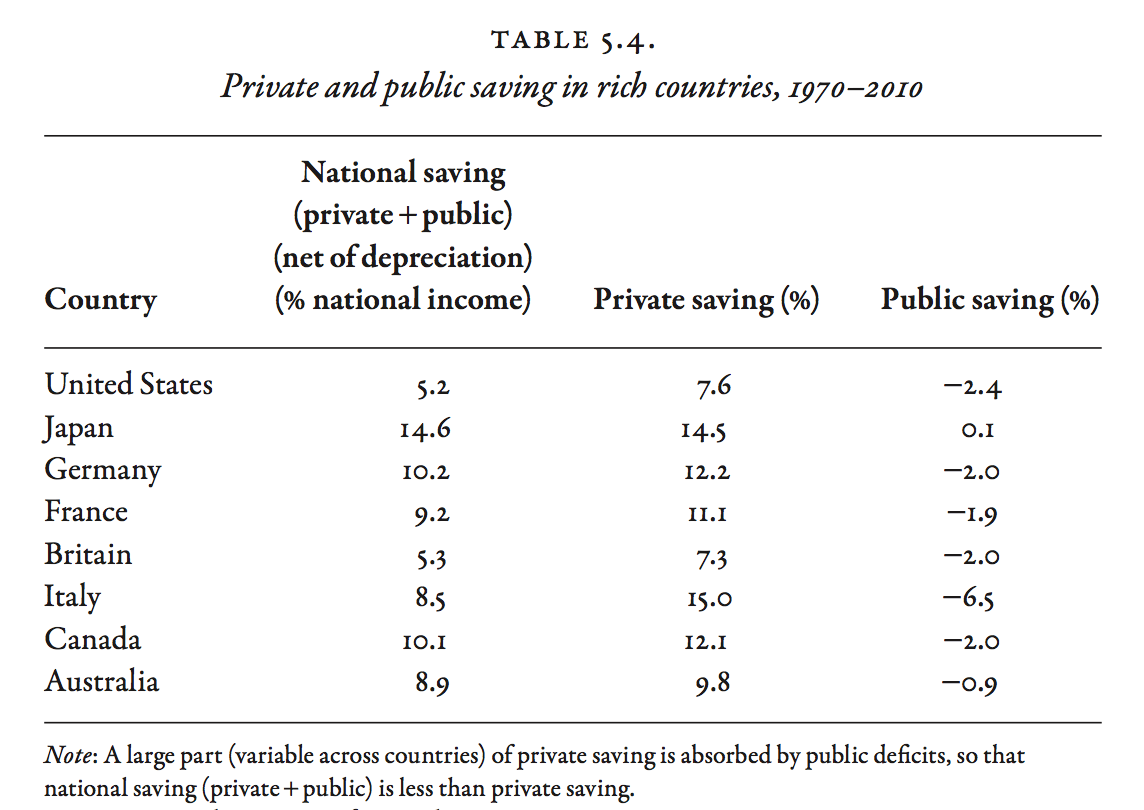
- Figure 5.1-5.5 show private and public capital in rich countries. Table 5.4 shows public and private saving.
- The gradual fall in public capital relative to national income during 1970–2010 is partly due to the privatization of public capital.
- Net public wealth in Italy was slightly positive in the 1970s, then turned slightly negative in the 1980s. During 1970–2010, public wealth fell by 100% of national income; private wealth rose from 250% to 700% — the fall in public wealth amounted to 1/4 of the rise in private wealth — national wealth rose from 250% to 600%. More than 1/3 of private saving was absorbed by government deficits.
Privatization
- A similar pattern is seen in France, the UK, Germany, and the US, where government deficits exceeded public investment by 2–3 percent of national income during 1970–2010, compared with more than 6% in Italy.
- The value of public assets in the 1970s appears to be seriously underestimated, implying that the transfer of wealth from the public to the private sector in the 1980s and 1990s is also underestimated. This could explain the large rise in private wealth in the UK, where saving rates are too low for to explain the rise.
- The most extensive privatization in the history of capital took place in the Soviet bloc after 1990 (Russian 'oligarchs').
The Rebound of Asset Prices
- The rebound of asset prices is a major cause of the rise of \(\beta\) in 1970-2010.
- Over the period 1910–2010 or 1870–2010, the 'second law' \(\beta = s/g\) explains the capital/income ratio — the greater \(\beta\) in Europe relative to the US is consistent with differences in saving rate and growth. The decline of 1910–1950 is consistent with low saving and shocks. The acceleration of 1980-2010 is consistent with the fall in the growth rate.
- The low point of 1950 is lower than the law predicts. Rent controls, regulation, taxes explain the depressed real estate and stock prices.
- After 1950, asset prices recovered, offsetting the fall of 1910-1950.
- Figure 5.6 shows Tobin's Q, the ratio of stock market values and accounting values ('book value') of listed companies. A Tobin Q greater than 1 may reflect stock market bubbles: Q fell rapidly after the Internet bubble burst in 2001–2002 and after the financial crisis of 2008–2009.
Net Foreign Assets
- Net foreign assets in rich countries is small relative to national capital.
- Japan and Germany have accumulated significant net foreign assets, especially in the 2000s (reflected in large trade surpluses). In 2010, the net foreign assets of Japan is 70% of national income, of Germany 50%.
- These positions, still lower than the UK (200%) and France (100%) in 1914, are rising. Will some countries become owned by Japan, Germany, China, Saudi Arabia? These questions are addressed in Chapter 12.
- Small differences in growth and saving rates tend to cumulate into large differences in capital accumulation and a tendency for countries with an excess 'demand' for wealth to invest massively in other countries.
- Large balance of payments differences can lead to international tensions (resentment, capital controls, exchange rate manipulations, trade wars).
Global Imbalances
- The 'second law' can explain very large international capital imbalances, as Japan shows. Even small net positions may hide large gross positions.
- International cross-investments are particularly prevalent in Europe, where financial assets held by other countries represent between 1/4 and 1/2 of total domestic financial assets. In larger economies such as the US and Japan, it is about 1/10.
- Financial flows associated with tax optimization strategies and regulatory arbitrage (via screen corporations in tax heavens) inflate some of these positions.
The Future of the Capital/Income Ratio
- Figure 5.8 shows the world observed and predicted \(\beta\) ratio.
- Since rich countries represent the largest share of capital, the world \(\beta\) ratio follows the same 'U-curve'.
- The predictions are based on the population and economic growth predictions presented in Chapter 2 — global output growth is predicted to decline from 3% a year to 1.5% in the late 21st century — and assuming the world saving rate will stabilize at 10%.
- The 'second law' predicts a long-run \(\beta\) of 700% by 2100, approximately the level of 18th century Europe.
Land Values
- The 'second law' \(\beta = s/g\) applies only to capital accumulated in markets — it does not apply to pure natural resources such as land.
- In the 18th century, farmland values in France and the UK reached 400% of national income. Investments and improvements represented at least 3/4 of this value.
- Even in a traditional society, the value of national capital originates in accumulation and investment (Modern capital depreciates faster than traditional land and requires more maintenance).
- Today farmland is worth less than 10% of national income.
Private & public capital in Europe & United States
National capital in Europe & United States, 1870-2010.
Private capital in rich countries
Private capital (% disposable income)
Public capital in rich countries
Private and public capital in rich countries
Market value and book value of corporations
National capital in rich countries