Chapter 7 -- Inequality and Concentration, Preliminary Bearings
Thomas Piketty, Capital in the 21st Century (Harvard University Press 2014)
Patrick Toche
Introduction
- This set of slides surveys selected topics from Capital in the Twenty-First Century, a book written by economist Thomas Piketty, published in English in 2014 to great acclaim.
- All source files for this course are available for download by anyone without restrictions at https://github.com/ptoche/piketty
- The full course is expected to be completed by April 2015.
- Chapter 6 analyzes the division of national income between labor and capital.
- Chapter 7 analyzes inequality and distribution at the individual level.
Inequality — A Bird's Eye View
- The two world wars and public policies were central to the reduction of inequalities in the 20th century — there was nothing natural about it.
- Inequality in income and wealth rose sharply after the 1970s, with large differences across countries.
- Does modern growth reward merit or birth rights?
Income inequality can be decomposed into 3 terms:
1. inequality in labor incomes;2. inequality in capital incomes;3. interactions of labor and capital.
Work Versus Inheritance
- There are large differences in incomes across individuals within a society (even in similar occupations) and across cities and countries.
- The democratic ideal is founded on the meritocratic ideal, the belief that inequalities in individual skills or effort ('merit') are more acceptable than inequalities in inherited material wealth ('unmerited').
- Inequalities in immaterial 'wealth' such as genes, IQ, EQ, educational achievements, business acumen are taken as a 'fact of life'. Few begruge Sam Walton's talent for accumulating wealth, yet many feel uncomfortable that so many Walton relatives remain among the top billionaires' lists.
Wealth and Power
- Social progress is challenged by extreme concentrations of wealth.
- George W. Bush in the US, Silvio Berlusconi in Italy, Thaksin Shinawatra in Thailand are recent examples of how the super rich can threaten the democratic ideal.
- The Roosevelt, Kennedy, and Bush political dynasties show how inherited wealth can help transmit political power across generations.
Philantropy Versus Inheritance
Vautrin's Wisdom
- In Balzac's novel, Père Goriot, set in 1810, ex-convict Vautrin gives up-and-coming Rastignac a sound piece of advice for the times: marry into wealth,
By the age of thirty, you will be a judge making 1,200 francs a year, if you haven’t yet tossed away your robes. When you reach forty, you will marry a miller’s daughter with an income of around 6,000 livres. Thank you very much. If you’re lucky enough to find a patron, you will become a royal prosecutor at thirty, with compensation of a thousand écus [5,000 francs], and you will marry the mayor’s daughter. If you’re willing to do a little po- litical dirty work, you will be a prosecutor-general by the time you’re forty... It is my privilege to point out to you, however, that there are only twenty prosecutors-general in France, while 20,000 of you aspire to the position, and among them are a few clowns who would sell their families to move up a rung. If this profession disgusts you, consider another. Would Baron de Rastignac like to be a lawyer? Very well then! You will need to suffer ten years of misery, spend a thousand francs a month, ac- quire a library and an office, frequent society, kiss the hem of a clerk to get cases, and lick the courthouse floor with your tongue. If the profession led anywhere, I wouldn’t advise you against it. But can you name five lawyers in Paris who earn more than 50,000 francs a year at the age of fifty?
Inequalities in Labor and Capital
- Income maybe divided into labor income and capital income. Income inequality arises from inequality in both components and from the interaction of the two — the extent to which individuals who earn high labor income also earn high capital income.
- The statistical correlation between the two components, at the individual level, tends to be small or negative: individuals who earn very large capital income often choose not to work.
- Inequality in capital incomes may be greater than inequality of capital, because the wealthy are able to secure greater returns on average — a form of 'economy of scale' explained in part by the 'monopoly' power of concentrated wealth.
Inequalities & Components
It is important to distinguish the components of inequality:
1. On 'moral' grounds- each component raises its own moral issue.
2. On 'scientific' grounds- the economic, social, and political mechanisms behind each component are distinct. Labor income inequality depends on the supply and demand in skills (and therefore on technology and education), on the determination of wages (legal constraints and institutions). Capital income inequality depends on savings and investment, gifts and inheritance, regulation and taxes.
Capital: More Unequal Than Labor
- Inequality of capital ownership and inequality of capital incomes are always greater than inequality of labor incomes, in all countries in all periods for which data are available, without exception.
- The top 10% of the labor income distribution receive 25%–30% of total labor income.
- The top 10% of the capital income distribution always own more than 50% of total wealth (in some countries 90%).
- The bottom 50% of the wage distribution receive 1/4 to 1/3.
- The bottom 50% of the wealth distribution own less than 10% and generally less than 5% of total wealth.
Sources of Capital Inequality
1. If wealth were accumulated as a buffer against labor income shocks, wealth inequality would be smaller than labor income inequality.- Quantitatively precautionary saving is not the primary explanation for the observed accumulation and distribution of wealth.
2. If wealth were accumulated to fund retirement, the target wealth level would be proportional to labor income, so as to maintain a similar standard of living.- Inequality of wealth would be a translation in time of inequality of labor income — social inequality would be caused by labor market outcomes.
- Quantitatively the life-cycle motive matters in ageing societies, but it is not the primary explanation. Observed concentrations of wealth are nearly as great within age cohorts as for the population as a whole.
Sources of Capital Inequality
3. The very high concentration of capital is explained mainly by the importance of inherited wealth and its cumulative effects.- For instance, it is easier to save out of labor (and other) incomes if you inherit an apartment and do not have to pay rent. Differences in inherited wealth get compounded over a lifetime.
Upper, Middle, and Lower Class

Inequality and Distribution
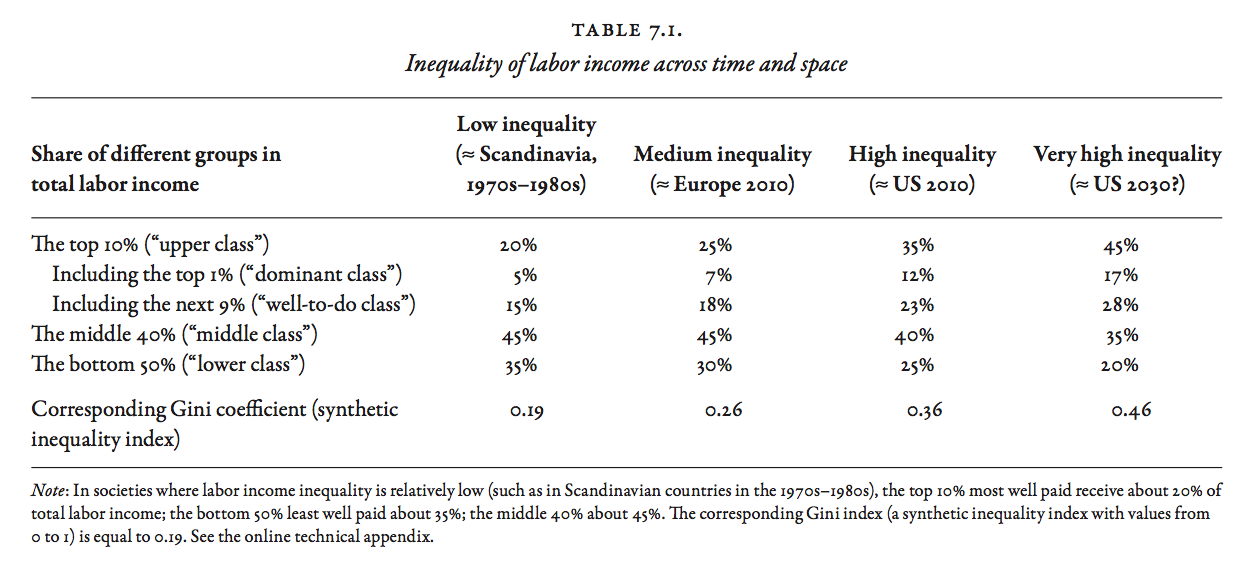
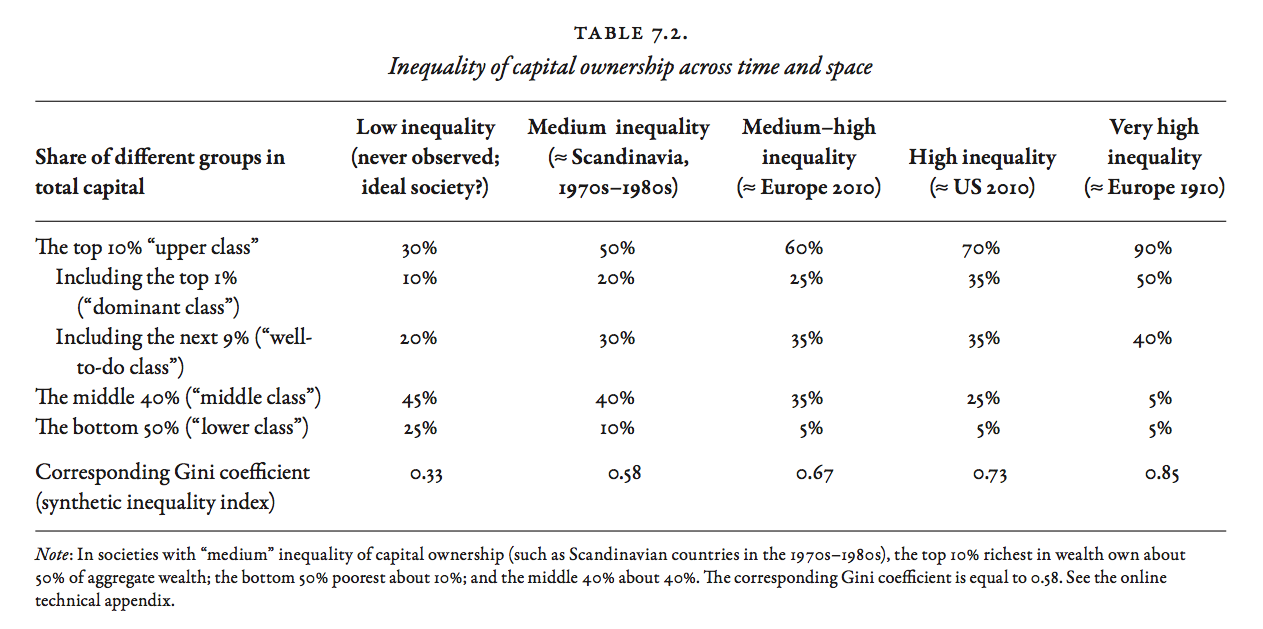
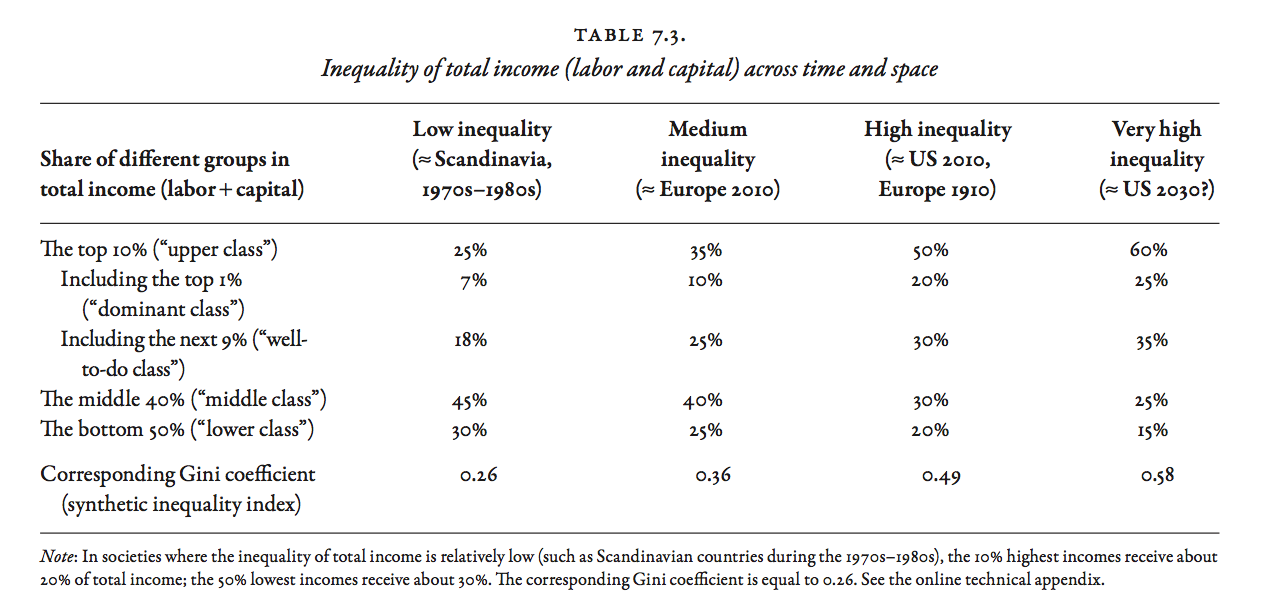
- Tables 7.1 to 7.3 show the pre-tax distributions in various countries at various times, for labor income, capital ownership, and total income.
In egalitarian societies — Scandinavian countries in 1970-1990:
1. the top 10% labor income earners earn 20% of total labor income;2. the bottom 50% earn 35%;3. and the middle 40% earn 45%.
Inequality and Distribution
- If the top 10% labor income earners receive 20% of the total, then mathematically this group earns on average twice the country's average.
- If the bottom 50% labor income earners receive 35% of the total, then this group earns on average 70% of the average.
- If the middle 40% receive 45% of total labor income, the average of this group is slightly higher than the average.
- If average labor income is 2,000 euros per month, this distribution implies that the top 10% earn on average 4,000 euros a month, the bottom 50% 1,400 euros a month, and the middle 40% 2,250 a month.
Lower, Middle, and Upper Classes
- In Tables 7.1-7.3, the 'lower class' is the bottom 50%; the 'middle class' is the middle 40%; the 'upper class' is the top 10%.
- In Piketty's definition of 'middle class,' the income of everyone in the group is, by construction, above the society's median — the 'middle class' refers to people who earn more than most but not as much as the 'elite.'
- The underlying social reality is a continuous distribution. There are no clear breaks between social classes. The percentiles and deciles of distributions allow objective comparisons across time and space, without the political connotations associated with concepts like the 'middle class'.
Income & Wealth Hierarchies
- The upper decile is a world unto itself: some people earn twice society's mean, others 100 times. The top decile may be broken down into the upper centile and the remaining 9 centiles.
- For example, in Scandinavia the share of labor income going to the top 1% — the top centile — is about 5%. The top 1% make on average 5 times the mean wage, i.e. 10,000 euros per month.
- The share of income/wealth going to the top decile or centile gives a sense of the number of individuals at the top. The top centile is a particularly interesting group to study. In the US, with 260 million adults (population 320 million), the top centile is 2.6 million adults.
- The hierarchies (deciles, centiles) are defined separately for labor income, wealth, and total income: The top 1% of the labor income distribution are not the as the same people as the top 1% of the wealth distribution.
Labor Income Inequality
Labor income inequalities are always much smaller than capital inequalities, but they are important, because:
1. labor income accounts for 2/3 to 3/4 of national income;2. for many labor income represents the bulk of total income;3. public policies impact labor income distributions;4. labor income inequalities translate into capital inequalities.
Labor Income Distributions
- Egalitarian: In Scandinavian countries during 1970-1990, the top 10% of labor income earners received about 20% of total labor income; and the bottom 50% received about 35%. The bottom 50% earn, on average, 2/3 of the country's average.
- Intermediate: In most European countries (minus the UK) today, the top 10% receive 25–30%; the bottom 50% receive about 30%. The bottom 50% earn, on average, 1/2 of the country's average.
- Inegalitarian: In the US today, the top 10% receive 35%; the bottom 50% receive 25%. The bottom 50% earn 1/3 of the country's average.
- Suppose the average wage is 2,000 euros a month. Egalitarian: the top 10% earns 4,000 euros on average; the bottom 50% earns 1,400 euros. Inegalitarian: the top 10% earns 7,000; the bottom 50% earns 1,000.
The Gender Gap
- Women are overrepresented in the bottom 50% of earners.
- The gender gap matters at all levels of the distribution: someone who earns 7,000 euros a month all their working lives, can sustain a higher standard of living and save more than someone who earns 4,000 — the same is true of someone who earns 24,000 rather than 10,000.
- The gender gap in labor incomes translates into a gender gap in the wealth distribution.
- Brazilian female soccer player Marta Vieira, 5-time winner of 'FIFA World Player of the Year', earns about \$400,000 pre-tax annually.
- Argentine male soccer player Lionel Messi, 4-time winner, earns about \$50,000,000 pre-tax annually — Messi earns 125 times more than Marta.
The Gender Gap
| Ranking | Country | Index |
|---|---|---|
| 1 | Iceland | 0.86 |
| 2 | Finland | 0.85 |
| 3 | Norway | 0.84 |
| 4 | Sweden | 0.82 |
| 5 | Denmark | 0.80 |
| 12 | Germany | 0.78 |
| 16 | France | 0.76 |
| 19 | Canada | 0.75 |
| 20 | United States | 0.75 |
| 26 | United Kingdom | 0.74 |
| 29 | Spain | 0.73 |
| 39 | Portugal | 0.72 |
| 75 | Russia | 0.69 |
| 87 | China | 0.68 |
| 114 | India | 0.65 |
| 130 | Saudi Arabia | 0.61 |
| 141 | Pakistan | 0.55 |
Capital Income Distributions
- The distribution of wealth is more unequal than wages everywhere.
- Egalitarian: In Scandinavian countries during 1970-1990, the top 10% own between 50 and 60% of national wealth.
- Intermediate: In European countries (UK, Germany, France, Italy), the top 10% own 60% of national wealth.
- Inegalitarian: In the US, the top 10% own 72% of wealth.
- The bottom 50% always own less than 10% of national wealth. In France, the bottom 50% own 4%. In the US, the bottom 50% own 2%.
- Countries that are inegalitarian in labor incomes are inegalitarian in wealth ownership and wealth incomes.
Hierarchies in a Rich Country
- Imagine a society in which average net wealth is 200,000 euros per adult, e.g. a rich European country.
- The bottom 50% make up 25% of population. They have at most a few thousand euros of savings in checking accounts. Their average wealth is 20,000 euros. Including durable goods (cars, furniture, appliances), average wealth is about 35,000.
- 1/10 of population have negative net wealth (more debts than assets).
- Top 10% own 60% of total wealth. Average wealth is 1.2 million euros — 6 times the country's average.
- Top 1% own 25%, with 35% to the other 9%. The top 1% is on average 25 times richer than the 9% — 5 million euros and 1.2 million euros.
Composition of Top Decile
- The composition of wealth varies widely within the top 10%.
- Nearly everyone in the top 10% owns a home, but the share of real estate decreases higher up the distribution.
- In the bottom 9% of the top decile, real estate accounts for 1/2 to 3/4 of total wealth.
- In the top 1%, shares of stock and partnerships make up more than 90% of total wealth.
- For wealth between 2 and 5 million euros, real estate accounts for 30%; above 5 million euros, for 20%; above 10 million euros, for less than 10%.
- Wealth at the very top consists primarily of financial and business assets.
Composition of Middle Deciles
- The 'middle class' of wealth lie between the bottom 50% and the top 10.
- The wealth of the 'middle class' ranges from 100,000 euros to over 400,000, with an average of 175,000 euros per adult.
- The 'middle 40%' own 35% of total national wealth.
- The primary residence and the way it is acquired plays a crucial role in distinguishing among members of the 'middle class'.
- For example, a net capital of 200,000 euros may consist of a house valued at 250,000 euros, with an outstanding mortgage balance of 100,000 euros, savings of 50,000 euros invested in a life insurance policy or a retirement savings account. Net wealth rises as the mortgage is paid off.
The Middle Class Rises
- The growth of a 'patrimonial middle class' is a major transformation of the distribution of wealth in developed countries in the 20th century.
- In 1900–1910: the concentration of capital was extreme everywhere. In Europe (including Sweden), the top 10% owned 90% of national wealth. The top 1% owned over 50%. The middle 40% owned between 5% and 10% of national wealth. The bottom 50% owned less than 5%.
- There was an abrupt transition from the bottom 90% to the top 10%.
- In 1900, there was no middle class.
The Middle Class Rises
- Today the top 10% own 60% of national wealth in Europe; 70% in the US. The bottom 50% still own only 5% in 2010, just as in 1910. But the middle 40% own about 30% of national wealth in Europe, 25% in the US.
- It may not seem like much, but something is always much better than nothing — a dollar to the poor raises 'utility' more than a dollar to the rich.
- As the patrimonial middle class emerged, the wealth share of the top 1% fell by more than half in Europe, from 50% in 1910 to 25% in 2010.
- Rastignac can go back to studying the law!
Inequality of Total Income
- Table 7.3 summarizes inequality in national income (income from all sources, including labor and capital).
- National income inequality lies between labor and wealth inequality.
- It is closer to labor income inequality. This is consistent with the fact that labor income accounts for 2/3 to 3/4 of national income.
- The top 10% received about 25% of national income in egalitarian societies (Scandinavia 1970-1990) and as much as 50% in more inegalitarian societies (the United Kingdom and France in 1700 and 1900, the United States in 2010).
The Winner-Take-All Society
- Two extremes are apparent in the 'winner-take-all' society: the 'hyper-meritocratic' and the 'hyper-patrimonial.' In the first, Sam Walton prospers, in the second his children, grandchildren, grandgrand — etc..
- The hyper-meritocratic model of superstars (super-managers, super-athletes, super-entertainers) has gained some acceptance. The popular perception of 'merit' is essential. All super-managers are not deserving: some appear to be at the right place at the right time and to bend the rules (Russian oligarchs, American bankers).
- The two types of inequality coexist (the children of the super-managers become super-rentiers) and can reinforce each other (the children of bankers become bankers who marry other bankers)
- The 'silver-spoon' society raises moral issues — the French revolution.
The Gini Coefficient
- The Gini coefficient — named after the Italian statistician Corrado Gini (1884-1965) — is a commonly used synthetic index of inequality.
- Gini = 0 if all resources are shared equally (perfect equality).
- Gini = 1 if all resources are held by a single individual (perfect inequality).
- The Gini of labor incomes ranges from 0.2 to 0.4.
- The Gini of wealth ranges from 0.6 to 0.9.
- The Gini of national income ranges from 0.3 to 0.5.
- The Gini of labor incomes in Scandinavia 1970-1990 was 0.19.
- The Gini of wealth in 1900 Europe was 0.85.
The Lorenz Curve and Gini Coefficient
| Name | Weekly Wage (Pound Sterling) |
|---|---|
| Marc André ter Stegen | 55,000 |
| Adriano Correia | 60,000 |
| Pedro Rodríguez | 60,000 |
| Sergio Busquets | 66,500 |
| Jordi Alba | 75,000 |
| Ivan Rakitic | 75,000 |
| Jérémy Mathieu | 90,000 |
| Javier Mascherano | 100,000 |
| Gerard Piqué | 120,000 |
| Dani Alves | 120,000 |
| Andrés Iniesta | 130,000 |
| Xavi Hernández | 130,000 |
| Neymar da Silva | 150,000 |
| Luis Suárez | 200,000 |
| Lionel Messi | 256,000 |
Table: Weekly wages for 15 players of Barcelona FC for 2014-2015.
Exercise: Chart the Lorenz curve and compute the Gini coefficient.
Synthetic Indices
- The one-dimensional Gini index cannot summarize the multi-dimensional complexity of inequality.
- Likewise, interdecile ratios often cited in official reports on inequality from agencies like the OECD — the P90/P10 is the most popular — cannot capture the shape of the distribution.
- For instance, the P90/P10 ratio ignores the distribution beyond the 90th percentile: any P90/P10 ratio is consistent with the top 10% receiving 20% of the total (egalitarian society) or 50% (inegalitarian).
- Synthetic indice can miss dramatic changes in distributions.
- The World Top Incomes Database (WTID) compiles entire distributions.