Chapter 9 -- Inequality of Labor Income
Thomas Piketty, Capital in the 21st Century (Harvard University Press 2014)
Patrick Toche
Introduction
- This set of slides surveys selected topics from Capital in the Twenty-First Century, a book written by economist Thomas Piketty, published in English in 2014 to great acclaim.
- All source files for this course are available for download by anyone without restrictions at https://github.com/ptoche/piketty
- The full course is expected to be completed by April 2015.
- Chapter 8 analyzed the historical evolution of inequality in France and the United States.
- Chapter 9 analyzes the dynamics of labor income inequality, in particular the recent explosion of wage inequalities and the rise of the supermanager.
Questions
- This chapter examines in detail the dynamics of labor income inequality.
- Are the changes that occurred in France and the United States typical of other countries?
- What caused the recent explosion in wage inequalities?
- What caused the rise of the supermanager in the United States after 1980?
- What accounts for the different evolutions in various countries?
The Race between Education and Technology
- What accounts for differences in wage inequality across countries and periods? One theory is that it reflects a race between education and technology. The theory is based on 2 hypotheses:
1. The wage is equal to the worker's marginal productivity.2. Marginal productivity is determined by relative demand/supply.- The marginal productivity of a worker's labor services is that worker's 'contribution' to output — whether observed or inferred.
- The 2 hypotheses will hold if the relevant markets are competitive. This rules out social conventions ('fair' wages), trade unions ('insiders' versus 'outsiders'), monopsony (public sector jobs), and other distortions ('minimum wages').
- Are the forces of competition strong enough to 'drive' the long run?
The Race between Education and Technology
- In a society in which few workers are qualified managers — the 'supply' of managers is low — and technology requires many managers — the 'demand' for managers is high — a competitive managerial pay package will be relatively high (wages, incentive pay, bonuses), relative to non-managerial pay.
- In this 'neoclassical' view of the labor market, low supply and high demand results in high labor income inequality.
- This theory explains certain historical evolutions, but cannot explain the rise of the supermanager in the United States after 1980.
The Supply Of Skills / The Demand For Skills
- The 'Education/Technology Race' theory emphasizes supply and demand in the market for skills.
1. The supply of skills depends on education, training, work experience...2. The demand for skills depends on technology, on the structure of production (manufacturing versus services), on the nature of the productive capital (capital-poor versus capital-rich), on the state of knowledge...- While other forces are at work, the market for skills plays a central role.
Education
- The supply of skills depends on the education.
- So does the demand for skills, since only educated managers will be able to design and/or adopt the leading edge technologies.
- Education depends on public policy, family finance, education costs.
- Technology depends on innovation, implementation, investment.
- Innovations raise the demand for new skills and creates new types of jobs. If the supply of skills does not rise fast enough to keep up with demand, then the pay of the skilled workers will rise relative to unskilled workers.
- To mitigate a rise in inequality, the supply of skills must keep up in a 'race' against the demand for skills.
Education: the case of France
- Consider wage inequalities in France. The wage hierarchy was fairly stable over a long period of time. While the average wage rose steadily, the gap between the highest and lowest deciles remained the same.
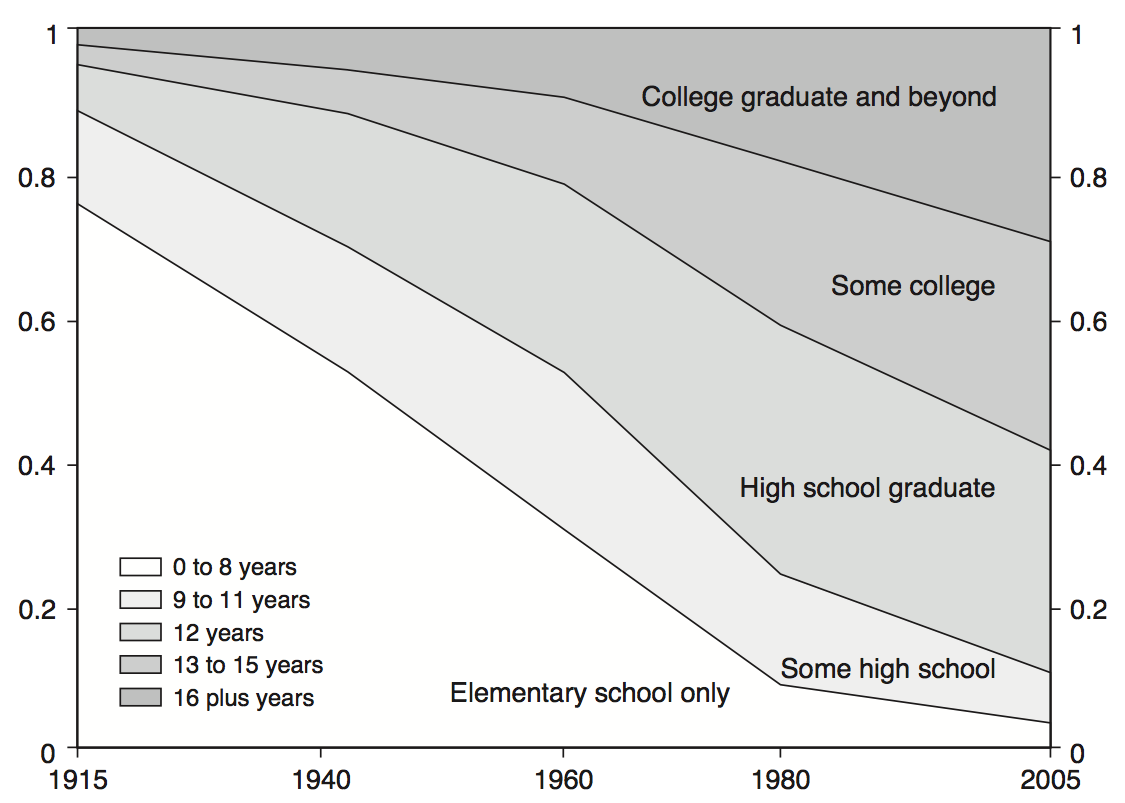
- A natural explanation is that all skill levels rose at the same pace. Workers in the lowest decile moved up a notch from 'grade' school to 'junior high' school — workers with a 'high school' diploma now go to 'university'.
- Inequality in educational achievements remain, but have not caused the observed increase in wage inequality.
- Without the large-scale rise in average education levels, labor income inequality would have increased — the rise in 'mass education' reflects the rise in 'mass consumption'.
Education: the case of the United States
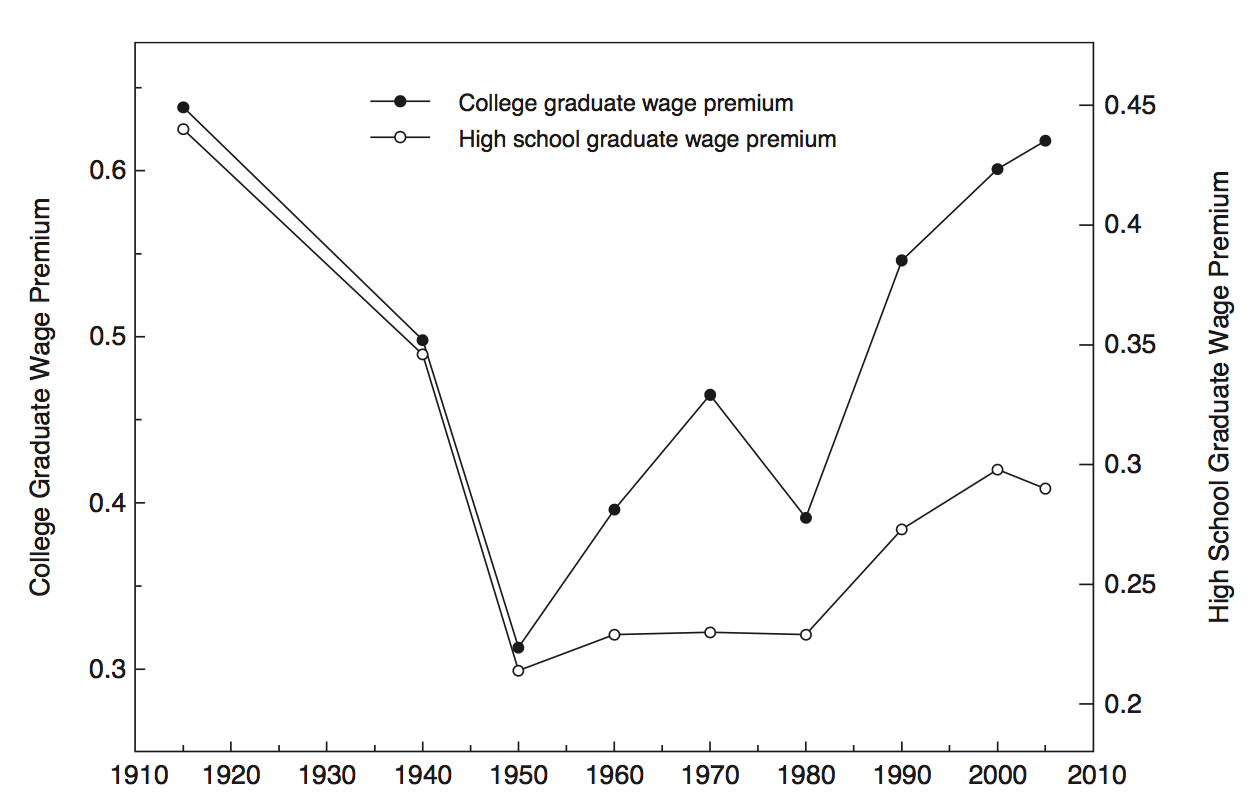
- Over the 20th century, Claudia Goldin and Larry Katz compared:
1. the wage gap between workers with a university degree and workers with a high school diploma;2. the rate of growth of the number of university degrees.- The two curves move in opposite directions.
- In 1980, the wage gap started to widen after a long period of shrinking.
- In 1980, the number of college graduates rose more slowly.
- Goldin and Katz see the rise of wage inequality as caused by a lack of investment in higher education. They see the high cost of tuition as the main drag on education, and therefore as the main cause of inequality.
Education and Wage Inequality
- The United States and France suggest that investment in education raises average labor productivity and reduces wage inequalities.
- Scandinavian countries suggest that an egalitarian and inclusive educational system reduces wage inequality.
- Education — how to pay for higher education and how to include the greatest number — is the key issue of the 21st century.
- In the advanced economies as elsewhere, children of educated and/or wealthy parents tend to accumulate higher skills than others — social mobility is tied to educational mobility.
The Role of Institutions
- Advanced economies devote a considerable share of output and employment to education and health care.
- Education and technology are central to inequality in the long run. But the marginal productivity theory cannot explain the worldwide diversity of wage distributions.
- The compression of wages in the 20th century was the result of negotiations over wage scales in both the public and private sectors.
- In the US, the National War Labor Board was created to oversee negotiations over wages.
- In France, changes in the minimum wage explain changes in wage inequalities at the bottom of the distribution during 3 subperiods: 1950–1968, 1968–1983, 1983–2012.
Minimum Wage Policies
- Figure 9.1 show the minimum wage in the United States and France. The minimum wage has an impact at the bottom of the distribution, where inequalities have closely followed the evolution of the minimum wage, but much less influence at the top, where other forces are at work.
- The United States raised the minimum wage through the 1950s and 1960s but froze it in the 1970s. The minimum wage reached its maximum purchasing power in 1969 (\$1.60 an hour — or \$10.10 in 2013 dollars), when the unemployment rate was below 4%. France froze the minimum wage in the 1950s and 1960s, but raised it through the 1970s.
- From 1980 to 1990, under Reagan and George H. Bush, the purchasing power of the federal minimum wage fell dramatically. It rose under Bill Clinton, fell under George W. Bush, rose under Obama. In 2013 it was \$7.25 an hour — one third below the French minimum wage.
Wage Rigidity
- What is the effect of minimum wages and rigid wage schedules?
1. It is difficult to measure the marginal productivity of a worker. For an assembly-line worker, estimates of how much additional revenue an additional worker would generate would change with fluctuation in sales, prices, and capacity use.2. It is not efficient for firms and workers to agree on fluctuating wages. The firm can absorb short-term shocks more easily and provide a 'wage insurance' as part of the employment contract. Early in the 20th century, the daily wage was gradually replaced by the monthly wage.3. Workers and firms make specific investments. Workers learn firm-specific skills. Firms adapt their organization to specific workers. Wage fluctuations reduce job-specific investments.
Wage Rigidity
4. If employers have more bargaining power than workers, wages may not be closely related to productivity (by contrast with the ideal perfectly competitive labor market). If wages are set below marginal productivity, a minimum wage raises efficiency.- Studies by David Card and Alan Krueger showed that the US minimum wage was so low between 1980 and 2000 that it could be raised without reducing employment. Piketty predicts that the rise in the minimum wage envisaged by the Obama administration, from \$7.25 to \$9 an hour (nearly 25 percent) would have little effect on jobs. Krugman and Stiglitz agree.
- In France or Germany, minimum wages are already relatively high, so a further rise would likely hurt employment.
Reducing Wage Inequalities
- The surest way to raise wages and reduce inequalities, in the long run, is to invest in education and skills.
- The minimum wage and other wage controls can play an important role at the bottom of the distribution in countries where employers' bargaining powers are unrestrained, but could hurt employment in countries where workers are already protected.
- The theory of marginal productivity and the race between education and technology cannot explain the explosion of very high labor incomes observed since the 1980s in e.g. the United States and United Kingdom.
Explosion of Inequality in the United States
1. The rise in wage inequality in the United States is due mainly to increased pay at the very top end of the distribution: the top 1% and especially the top 0.1% — labor incomes between \$100,000 and \$200,000 a year have risen only slightly faster than the average, whereas incomes greater than \$500,000 a year have grown much faster — and incomes above \$1 million a year faster still.- Marginal productivity theory points to skill-biased technological change. However, the sharp discontinuity at the very top is not consistent with observed skills — there is no corresponding discontinuity in observed skill levels between the 9% and the 1% or between the 1% and the 0.1%, even taking a broad view of 'skill' (education, IQ, experience).
The Rise of the Supermanager
2. The explosion of very high labor incomes has occurred in some advanced countries but not in others, suggesting that country-specific differences are crucial and that universal causes such as technological change can be ruled out.- The rise of the supermanager is largely an Anglo-Saxon phenomenon. After 1980, the income share of the top centile started rising sharply in the United States, United Kingdom, Canada, and Australia. The explosion of top labor incomes explains at least 2/3 of the rise in top incomes, and has occurred in both the financial and nonfinancial sectors.
- Cross-country differences would not be so large if the rise of the supermanager were a purely technological phenomenon.
CEO Compensation
- The largest increases in compensation have been concentrated at the very top of the wage distribution (top 1% and top 0.1%), affecting some countries more than others.
- Data about individual firms cannot explain observed variations in terms of firm performance, as measured by sales growth, profit, and so on.
- Compensation depends on country-specific norms. Since the 1980s social norms have become more tolerant of generous pay packages.
- Bertrand and Mullainathan (QJE, 2001) explain CEO compensation as 'pay for luck': when sales and profits rise for reasons external to the firm, executive compensation rises most rapidly.
- Senior managers of large firms is on several boards and, as part of a network, set their own compensation!
The Rise of Top Incomes
- Figure 9.2 shows that in the 1970s, the income share of the top centile was similar across countries — between 6% and 8%. (Canada was then slightly higher than the US!) In 2010, the top centile's share is 20% in the United States, 15% in the United Kingdom and Canada, 10% in Australia.
- The income share of the top centile has risen much less in continental Europe and Japan than in the Anglo-Saxon world.
- The top centile share has risen by 2 or 3 points of national income over the past 30 years, in both northern and southern Europe.
- In Japan, France, Italy and Spain, the top centile share rose from 7% in 1980 to 10% in 2010. In Sweden, it rose from 4% to 7%. In Germany, from 9% to 11%. In Denmark and other Nordic countries, from 5% to 7%.
The Rise of Top Incomes
- Figure 9.5 shows the income share of the top 0.1% between 1980 and 2010 for Anglo-Saxon countries. Figure 9.6 shows the same for continental Europe and Japan. The differences between the two groups are large.
- In the United States, the share rose from 2% to 10%. In France and Japan, it rose from 1.5% to 2.5%. In Sweden, it rose from 1% to 2%.
- A 2% share of national income for 0.1 percent of the population means that the average individual in this group gets an income 20 times greater than the national average — 600,000 euros a year if the average is 30,000.
- A 10% share means that the average individual in this group gets an income 100 times greater than the national average — 3 million euros a year if the average is 30,000.
The Rise of Top Incomes
- The transfer of income to the top 1 percent has been limited to 2 or 3 points of national income in continental Europe and Japan compared with 10 to 15 points in the United States — 5 to 7 times more. Meanwhile the purchasing power of the average person has largely stagnated.
- In a country of 50 million adults (the United Kingdom, France, Italy today), the top 0.1% includes 50,000 people; the top 0.01% includes 5,000 people. These are select groups.
- The divergence is striking because technological change has been the same more or less everywhere: in particular, the revolution in information technology has affected Japan, Germany, France, Sweden, and Denmark as much as the United States, United Kingdom, and Canada.
Europe and the New World
- The United States was not always more inegalitarian than Europe.
- The US was less inegalitarian than Europe in 1900–1910, slightly more inegalitarian in 1950–1960, and much more inegalitarian in 2000–2010.
- In 1900, the national income share of the top centile was below 20% in the United States, Canada, Australia, New Zealand, and above 20% in Japan and all European countries, including Sweden and Denmark.
- In 1900, top incomes consisted almost entirely of capital income. Why was capital so concentrated in Europe in 1900?
- Low population growth rate in Europe resulted in greater accumulation and concentration of capital.
Income Inequality Between the Wars
- The interwar period was chaotic almost everywhere.
- While the United Kingdom and France started to rebuild after 1918, Germany was forced to make war payments to the allies.
- In The Economic Consequences of the Peace (1919), John Maynard Keynes argued that war debts should be forgiven, a vast credit program launched throughout Europe, and that this would benefit everyone. The book was a best seller. The Versailles Conference imposed a "Carthaginian peace" on Germany — Carthago delenda est — Germania delenda est.
- Germany experienced hyperinflation in the 1920s. The depression came, the Nazis followed. The top centile's share of national income rose rapidly between 1933 and 1938 — out of phase with other countries, reflecting the return to industrial profit, boosted by re-armament (Aufrüstung), and the return of income hierarchies.
Inequality in Emerging Economies
- The top centile national income share is similar in poor and rich countries.
- The top centile share was highest in 1910–1950 at about 20%:
- 15–18% in India
- 22–25% in South Africa, Indonesia, and Argentina.
- The top centile share was lowest in 1950–1980 at about 10%:
- 5–6% in India
- 8–9% in Indonesia and Argentina
- 11–12% in South Africa.
- After the 1980s, the top centile's share has risen steadily.
Inequality in Emerging Economies
- Figure 9.9 also shows China and Colombia.
- While China has remained relatively egalitarian, Colombia is the most inegalitarian country in the WTID.
- In China, the top centile income share has risen fast since the mid 1980s, peaking at 10-11%, less than India or Indonesia, similar to the United Kingdom or Canada.
- In Colombia, the top centile income share has remained at 20% throughout 1990–2010.
Data in Emerging Economies
- Historical sources are rare in poorer countries.
- The United Kindom introduced a progressive income tax at home in 1909 and later in some of its colonies: South Africa in 1913, India (including Pakistan and Bangladesh) in 1922.
- The Netherlands introduced an income tax in Indonesia in 1920.
- The income tax in less developed countries generally applies to only a small minority of the population.
- India stopped publishing detailed income tax data in the early 2000s.
- Despite its flaws, tax records reveal much greater income levels than household surveys.
Data in Emerging Economies
- Official production statistics and household survey data are inconsistent.
- In India and China, survey-based growth rates are lower than the official output statistics.
- This 'black hole' could be the result of large shares of output growth going to the very top, since top incomes are not always captured in the tax data.
- In India, during 1990-2000, the rise in the top centile could explain 1/3 of the 'black hole' of growth.
- Chinese official tax records are less informative still.
Goldin & Katz: Education in the United States
Goldin & Katz: Education in the United States
Goldin & Katz: Education in the United States
Goldin & Katz: Education in the United States
Goldin & Katz: Supply Of and Demand For Skill
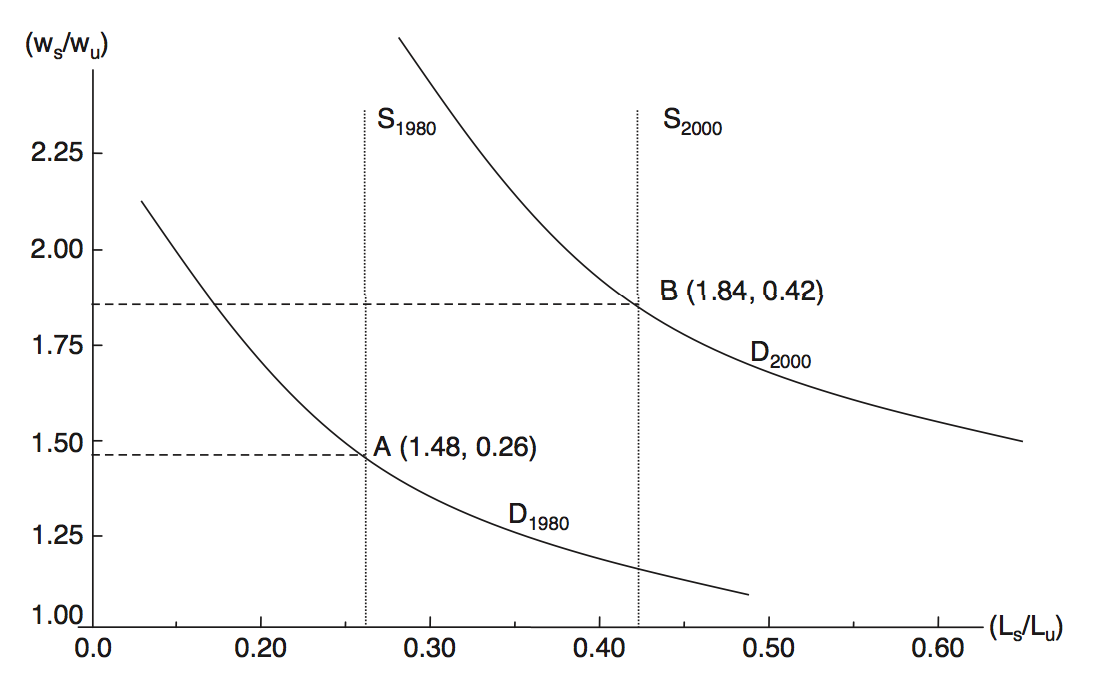
Goldin & Katz: Education and the Wage Premium
Goldin & Katz: Education in the United States
- Refer to Figure 3.1 in Claudia Goldin & Lawrence F. Katz, The Race Between Education and Technology (Harvard University Press, 2008).
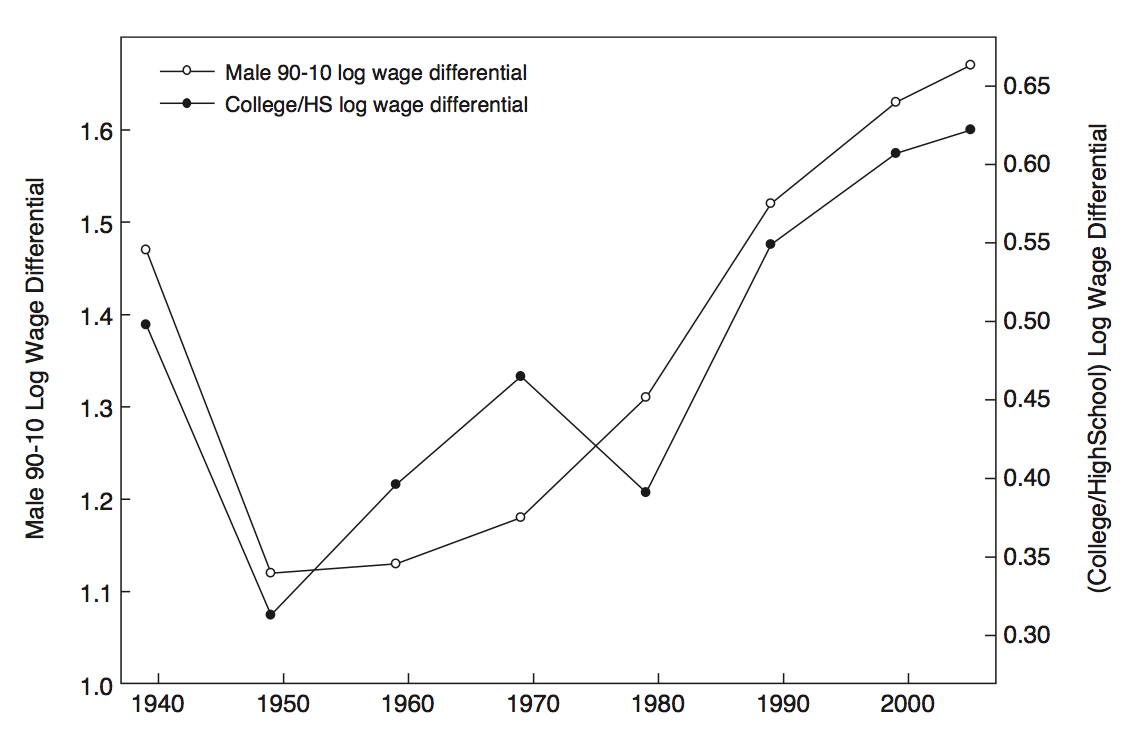
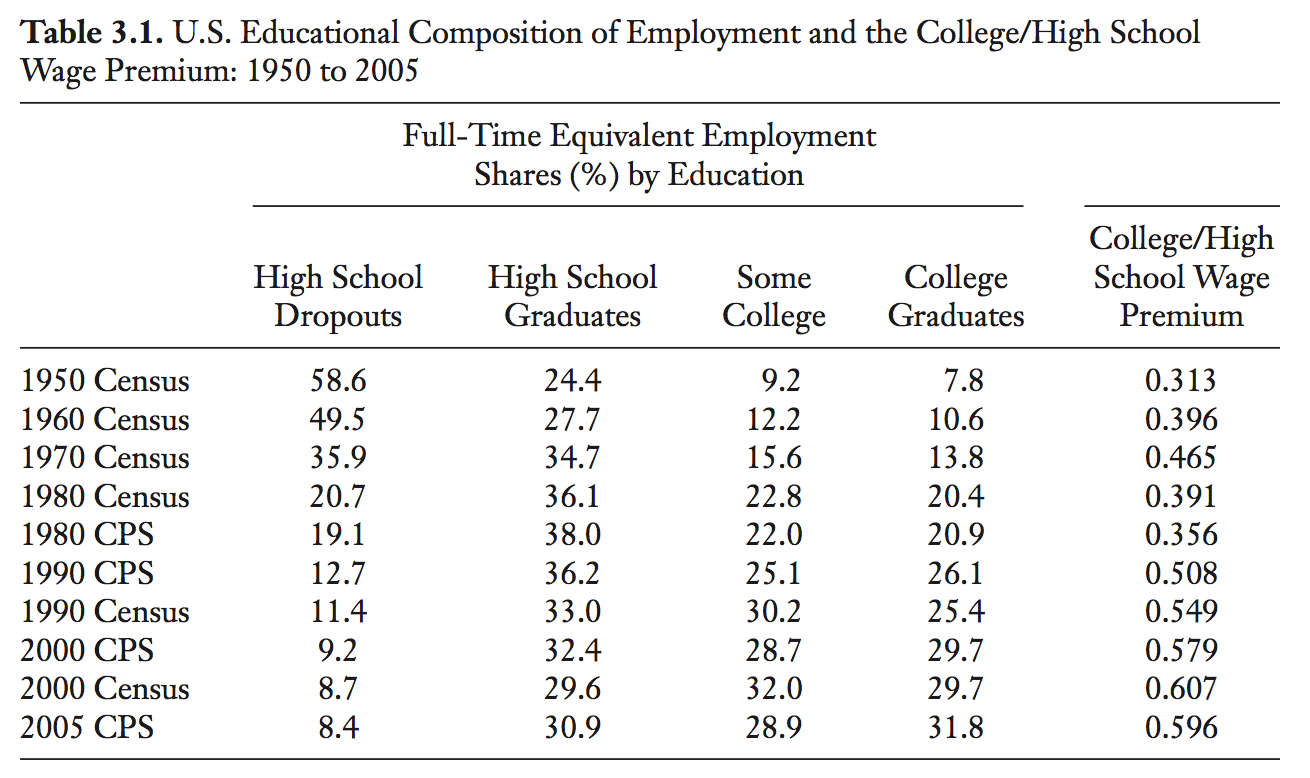
- Point A is approximately the values for (\(w_s/w_u\)) and (\(L_s/L_u\)) from Table 3.1 (using the 1980 Census data and exponentiating the college/high school wage premium) and point B is the same for 2000 (using the 2000 Census data), where \(L_s/L_u\) is the ratio of college graduates to those with less than a college degree as per the selection criteria given in Table 3.1. Thus, point A is \(e^{0.391} = 1.48\) for (\(w_s/w_u\)) and \(0.26\) for (\(L_s/L_u\)).
Goldin & Katz: Education in the United States
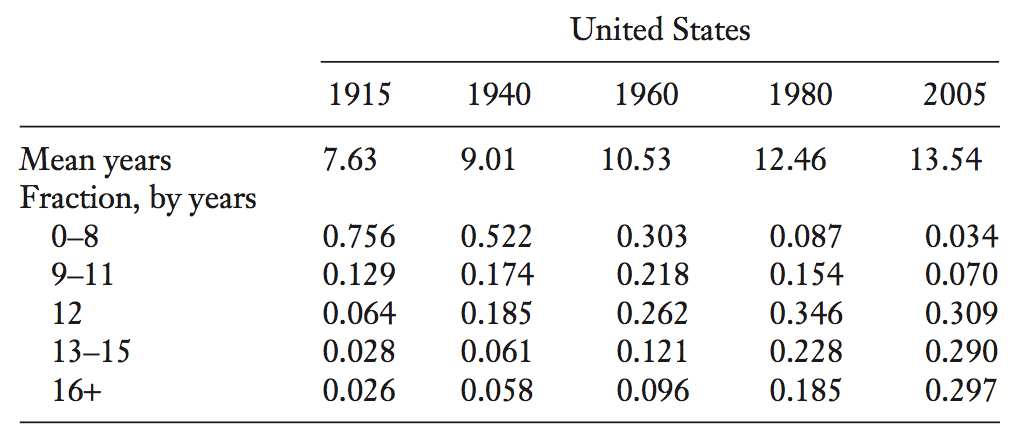
- Refer to Table 3.1 in Claudia Goldin & Lawrence F. Katz, The Race Between Education and Technology (Harvard University Press, 2008).
- The college/high school wage premium is expressed in logs.
- Educational wage differentials in each year are estimated using standard cross-section log hourly earnings regressions for wage and salary workers in each sample with dummies for single year of schooling (or degree attainment) categories, a quartic in experience, three region dummies, a part-time dummy, a female dummy, a nonwhite dummy, and interaction terms between the female dummy and quartic in experience and the nonwhite dummy.