Chapter 10 -- Inequality of Capital Ownership
Thomas Piketty, Capital in the 21st Century (Harvard University Press 2014)
Patrick Toche
Introduction
- This set of slides surveys selected topics from Capital in the Twenty-First Century, a book written by economist Thomas Piketty, published in English in 2014 to great acclaim.
- All source files for this course are available for download by anyone without restrictions at https://github.com/ptoche/piketty
- The full course is expected to be completed by April 2015.
- Chapter 9 analyzed the dynamics of labor income inequality, in particular the recent explosion of wage inequalities and the rise of the super-manager.
- Chapter 10 reviews the historical evolution of wealth inequality and the factors behind the historic compression of inequality.
Inequality of Wealth Ownership
- This chapter analyzes the historical evolution of wealth inequality.
- Recall that the fall in total income inequality in 1910-1950, observed in the United States, France, and elsewhere, was due to a fall in wealth inequality, while labor income inequality remained unchanged.
- The concentration of capital ownership is on the rise again and the prospect of a worldwide growth slowdown makes it especially worrisome.
- Why was wealth concentration so extreme, and rising, before World War I?
- Why is wealth concentration still below its historical high in Europe today?
Wealth Concentration
- We have fairly complete historical estimates for the United States, United Kingdom, France, and Sweden. The lessons are consistent.
- The distribution of wealth — and therefore of capital income — is always much more concentrated than the distribution of labor income.
- The bottom half own very little wealth — less than 5% everywhere.
- The top decile own most of the wealth — between 60% and 90%.
- The middle class own between 5% and 35% of all wealth.
- The 'patrimonial middle class' are the 40% in the middle.
History of Private Wealth: France
- France is the only country with homogeneous historical sources going back to the 1790s. With the French Revolution, a wealth registry and a tax on estates/bequests and gifts was created in 1791, covering all types and sizes of property and assets. From 1791 to 1901, the estate and gift tax was strictly proportional, set between 1% and 2%.
- In addition, Piketty, Postel-Vinay and Rosenthal have collected thousands of individual declarations and constructed large samples for each decade from 1800–1810 to 2000–2010.
- In the United Kingdom, comparable detailed series go back to 1919 only.
- In the United States, the federal tax on estates and gifts was created in 1916, but covered only a small minority of the population.
- The large shock of WWI cannot be analyzed in these countries.
Wealth Concentration in France
- Figure 10.1 shows the wealth distribution from 1810 to 2010.
- There is no trend toward reduced inequality until the shocks of 1914-1945.
- The top decile owned about 80% of total wealth in 1800, 90% in 1900.
- Large increases in 1880-1910 were interrupted by WWI.
- Figure 10.2 compares France with Paris, the largest and wealthiest city.
- The concentration of wealth was greater in Paris. Paris had 1/20th of the population in 1900, 1/4 of the wealth.
- The top wealth centile owned nearly 50% in 1800, 60% by 1900.
Wealth Concentration in France
- In the 18th and 19th centuries, inequality of capital ownership remained relatively stable at an extremely high level.
- The top wealth decile consistently owned 80% to 90% and the top centile 50% to 60%.
- On the eve of the French Revolution in 1789, the top wealth decile may have exceeded 90%. The French Revolution had no long-term effect on the capital/income ratio.
- The probate data reveals that the percentage of aristocratic names in the top centile of the Parisian wealth hierarchy rose from 15% in 1800 to 30% in 1850, before falling after 1850, to less than 10% in 1900.
Wealth Concentration in Europe
- The extreme concentration of wealth in the 18th and 19th centuries and until the eve of World War I was a European phenomenon.
- The fall in the top wealth decile in 1914–1945 benefited the middle 40% of the population — the share of the poorest half remained below 5%.
- At all times, half of the population died without any wealth to bequeath.
- Industrial capital, financial wealth, real estate quickly replaced farmland.
Wealth Concentration in Europe
- Figures 10.3 shows wealth concentration in the United Kingdom.
- The top wealth decile exceeded 90% in 1914.
- The top wealth centile rose from 55% in 1810 to 70% in 1914.
- The French Republic and the British monarchy reached comparable levels of wealth concentration. The political regime mattered none.
- Figure 10.4 shows wealth concentration in Sweden.
- Sweden was not an egalitarian country in the 19th century — its history is similar to the UK and France until WWII.
The Patrimonial Middle Class
- Wealth concentration has not returned to the extreme levels of 1914 after the shocks of 1914–1945.
- Throughout Europe (UK, France, Sweden), a similar pattern: The top wealth decile fell from 90% in 1914 to 60% percent in 1945. The top wealth centile fell from 60% in 1914 to 20% in 1945. And today the top decile has risen to 'only' 60% to 70%.
- Wealth owned by the 'patrimonial middle class' has risen and reaches about 1/3 of total wealth today.
- In Europe, the losses of the top wealth decile benefited the 'patrimonial middle class,' with no gain for the poorest half of the population.
Wealth Concentration in the United States
- Figure 10.5 shows wealth concentration in the United States.
- The United States have probate statistics going back to 1910.
- Wealth concentration in 1800 was similar to Sweden in 1980.
- Population consisted mostly of immigrants with little or no wealth.
- Wealth became increasingly concentrated in the 19th century.
- In 1910, the top wealth decile owned 80%, the top centile 45%, not as high as Europe then.
Wealth Concentration in the United States
- The 'Gilded Age' of capitalism, in late 19th century, saw massive wealth accumulation by a few industrialists and financiers — John D. Rockefeller, Andrew Carnegie, J.P. Morgan.
- The perception of the US as an egalitarian society started to change!
- In 1910–1920, the US pioneered a very progressive estate tax on large fortunes and a progressive income tax on very high incomes.
- The top wealth decile fell from 80% to 70% — in Europe, from 90% to 60%.
- These attempts to restore the 'egalitarian spirit' of America waned gradually and disappeared during 1980–2000.
- In 2010, the top wealth decile exceeded 70%, the top centile about 35%.
A Mechanism of Wealth Divergence: r > g
- Piketty's main claim is that wealth divergence arises from an excess of the return on wealth over the economy's growth rate.
- Piketty claims that \(r>g\) implies wealth concentration.
- If the 'Piketty inequality' holds, wealth accumulated in the past is recapitalized more quickly than the rate at which total income grows.
- This situation is typical of the 18th and 19th century.
A Mechanism of Wealth Divergence: r > g
- Consider a low-growth economy: \(g = 1\%\).
- Suppose the rate of return on wealth is greater: \(r = 5\%\).
- If \(g = 1\%\) and \(r = 5\%\), saving only 1/5 of capital income guarantees that wealth inherited from the previous generation grows at the same rate as the economy.
- Saving more guarantees that wealth rises faster than the economy.
- Inequality of wealth will tend to increase.
- Large inequalities in labor income (media superstars) are irrelevant.
The 'Piketty Inequality' in France
- Consider France between 1820 to 1914.
- Figure 10.7 shows that the rate of return on capital was significantly higher than the growth rate, with \(r \simeq 5\%\) and \(g \simeq 1\%\).
- Figure 10.8 shows that capital income accounted for 40% percent of national income, and it was enough for 'capitalists' to save 1/4 of capital income for the national saving rate to reach about 10%.
- Chapter 11 shows that most wealth was inherited during this period.
The 'Piketty Inequality' Around the World
- The 'Piketty Inequality' \(r>g\) is a historical fact — not a logical necessity.
- From the dawn of history to the industrial revolution annual growth rates never exceeded 0.1% or 0.2% for long. But the annual rate of return on wealth was always considerably greater.
- The return on land in most traditional agrarian societies was 4% or 5%.
- Even accounting for labor input in wealth management, the return on wealth exceeds 2% and probably 3% in all societies at all times.
- The rate of return on wealth is always 10 to 20 times greater than the economy's rate of growth.
- If the 'Piketty Inequality' did not hold, capitalists might not be so willing to make the risky investments and loans that contribute to economic growth.
The 'Piketty Inequality' Around the World
- Figure 10.9 shows the world rate of return on wealth and the world growth rate of output since antiquity. These pre-tax returns do not include capital gains and losses, which were large in the 20th century.
- Before WWI, wealth taxes were very low. After WWI, taxes on top incomes, wealth, and profit rose sharply. After WWII, they were cut everywhere.
- Figure 10.10 shows estimates that include capital losses due to destruction of property in the period 1914–1945, assumes an average tax rate on capital of 30% for 1913–2012, 10% for 2012–2050, and 0% for 2050–2100.
- In the 20th century, the net return on capital was less than the growth rate, for the first time in history, owing to both fiscal and non-fiscal shocks.
- In all likelihood, the \(r-g\) gap will widen again in the 21st century as economic growth slows — especially demographic growth.
Returns on Wealth as the Price of Impatience
- The 'time preference theory' suggests that high returns on wealth reflect the market's high impatience.
- The perfect-markets infinite-horizon forward-looking representative agent 'neoclassical' growth model — the most extreme form of the impatience theory — is refuted by historical evidence.
1. The model predicts the rate of return will not deviate much from the rate of impatience — changes in the post-tax net return trigger an immediate and strong response in saving behavior, and bring it back in line with impatience. But evidence suggests that if the interest-rate elasticity of saving is positive, it is not large, and certainly not infinite.2. The neoclassical model implies that the gap between the rate of return on wealth and the growth rate, \(r-g\), is increasing in the growth rate \(g\). This prediction too is contradicted by historical evidence.
Extreme Logic of the Impatience Theory
- In the neoclassical model, perfect capital markets (perfect information, no moral hazard) imply that the rate of return on liquid wealth is bid to the highest investment available, and at that rate potential investors can borrow as much as profitable.
- The 'Piketty Inequality' \(r>g\) holds necessarily. If \(r\) were less than \(g\), agents would expect their — and their descendants' — future income to grow faster than the loan rate, inducing them to borrow without limit.
- As capital markets become more efficient, the 'neoclassical' logic behind \(r > g\) is even more compelling.
- In addition to time preference, precautionary savings, life-cycle effects, conspicuous wealth, and other factors matter.
Equilibrium Distribution of Wealth
- If the fortunes of wealthy individuals grow more rapidly than average income, the capital/ income ratio will rise indefinitely and lead to a fall in the rate of return on capital.
- The 'law of diminishing returns' can take decades to operate, especially in an open economy in which wealthy individuals can accumulate foreign assets — as in the United Kingdom and France in the 19th century.
- Shocks can also counter this tendency: death and inheritance, bad investments, a financial crisis can disperse wealth.
Illusions of the French Revolution
- Many traditional aristocratic societies were based on the principle of pri- mogeniture: the eldest son inherited most of the family property so as to preserve the family's wealth and maintain its power. The freedom to bequeath still prevails in the United States and United Kingdom, though in practice most estates are equally divided among siblings.
- The French revolution introduced equipartition of estates between siblings. Yet, the concentration of wealth increased steadily throughout the 19th century and peaked at level similar to the British parliamentary monarchy.
- If the rate of return on capital durably exceeds the growth rate, wealth becomes more concentrated and the dispersion of inheritance is not enough to make a big difference.
Wealth Distribution and Pareto
- Analyzing how rapidly the number of taxpayers decreases at higher quantiles of income, Pareto discovered a 'Power law' — a family of functions that mimicks the upper tail of income distributions.
- The 'Pareto coefficient' measures the degree of inequality. It varies enormously across times and places.
- In models where income is subject to multiplicative shocks, the long-run equilibrium distribution is typically a Pareto distribution.
- The 'Pareto coefficient' is a steeply increasing function of \(r-g\).
- With a rate of return of 5% and growth of 1%, the top wealth decile will own about 90% and the top wealth centile about 50%.
- If the difference \(r-g\) surpasses a certain threshold, there is no equilibrium distribution and inequality increases without limit.
Why Has Wealth Inequality Not Risen More?
1. Capital accumulation is a long-term process extending over several generations. The great concentration of wealth observed on the eve of WWI was the result of many decades of accumulation and transmission.2. The capital income share has fallen.3. The rate of return on capital income has fallen.4. The economic growth rate was high until the 1980s.5. After 1945, taxes on dividends, interest, profits, and rents, were introduced. An average tax rate of 30% reduces a pre-tax return of 5% to a post-tax return of 3.5%. These policies have played a large role.6. In the face of wars, depression, inflation, many rentiers maintained expenses inconsistent with lower wealth and incomes.
Why Has Wealth Inequality Not Risen More?
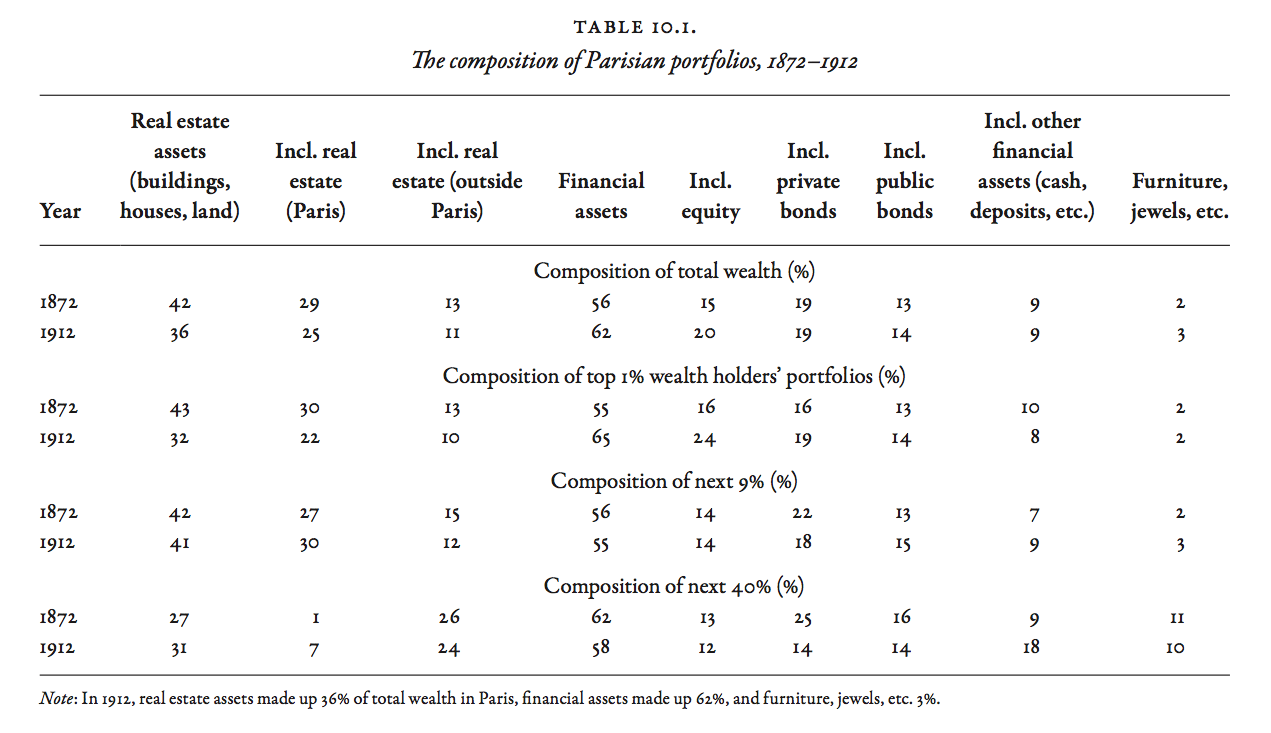
- Table 10.1 shows that in 1900 Parisian portfolios were diversified: 1/3 in real estate (2/3 in Paris and 1/3 in the provinces) and 2/3 in financial assets (both French and foreign stocks, public and private bonds). The rentier of 1900 did not belong to the 'landed class.'
- In 1900, the wealthiest \(1\) percent of Parisians had capital income 80-100 times the average wage. In 1940, capital income had fallen to 20 times the average wage. 'Eating the capital' was crucial to the fall in wealth concentration of 1914-1945.
- The future of wealth concentration is difficult to foresee: taxes, interest rates, growth rates, especially demographics, and the pattern of inheritance will all play a part.